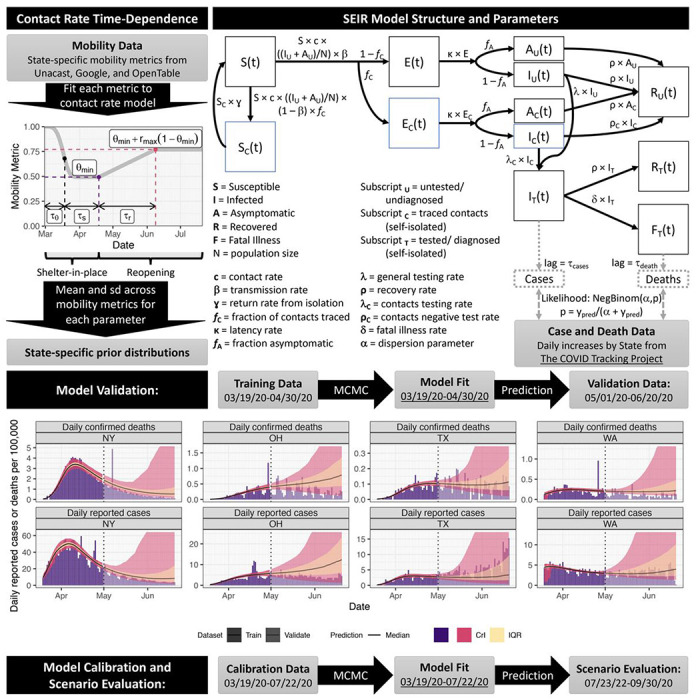
Figure 1. SEIR model structure, parameter, data sources, and fitting/validation methods.

We used mobility data to constrain the time-dependence of the contact rate. We fitted the model to daily reported cases and confirmed deaths from March 19th to April 30th and validated its projections against data from May 1st to June 20th. On the model projections, the black solid line is the median, the pink band is the 95% credible interval (CrI) and the orange is the interquartile range (IQR). We show model fitting and validation for four states: New York (NY), Ohio (OH), Texas (TX), and Washington (WA).
