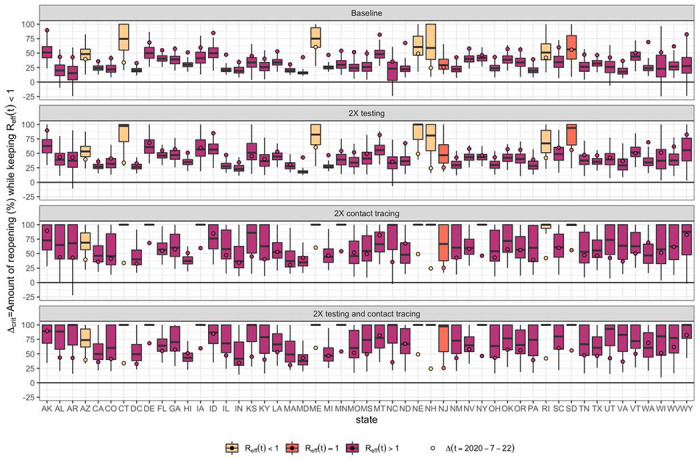
Figure 4. Reopening/rebound in transmission Δcrit permitted (0% = minimum shelter-in-place value, 100% = return to no restrictions) to keep Reff < 1.

(A) If testing and contact rates are unchanged, (B) testing rate is doubled, (C) contact tracing is doubled, or (D) both testing and contact tracing are doubled. Δ (t) the level of reopening/rebound in transmission on July 22nd, 2020 is shown by the circle. All boxplots show median, IQR, and 95% CrI.
