Figure 4.

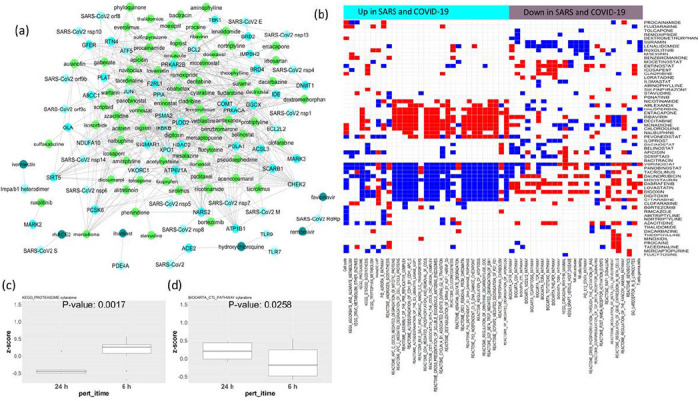
(a) The network of drugs targeting the host (human) proteins interacting with SARS-Cov-1 and SARS-Cov-2. The light green nodes are the drugs that downregulate the expression of the host genes that interact with SARS-Cov-1 or SARS-Cov-2. The interactions of SARS-Cov-2 with host proteins are collected from Gordon et al.9; the drugs targeting the host proteins are collected from DrugBank and DGIdb10,11; and the drug-induced changes in gene expression (time- and dose-dependent) in cell lines are collected from CMAP14. The dark green nodes are currently in clinical trials for COVID-19 (collected from literature). (b) The map shows the drugs from Figure 3a that significantly affect the pathways upregulated (cyan column-side colors) or downregulated (purple column-side colors) in SARS and COVID-19 infection. Blue cells indicate the pathway gets significantly downregulated by the drug (p < 0.05), while red indicates the pathway gets significantly upregulated by the drug in a time-dependent manner (measured by differences in pathway ssGSEA scores at 24 hours vs. 6 hours of drug treatment from CMAP). (c-d) The boxplots show the differences in ssGSEA scores for the pathways KEGG_Proteasomes (high in SARS and COVID-19 infection) and BIOCARTA_CTL_pathway (low in SARS and COVID-19 infection) at 6 hours vs. 24 hours of treatment with the drug cytarabine. Significant downregulation of KEGG_Proteasomes and significant upregulation of BIOCARTA_CTL_pathway are seen as an effect of cytarabine at 24 hours compared to 6 hours (cell line drug treatment data from CMAP).
