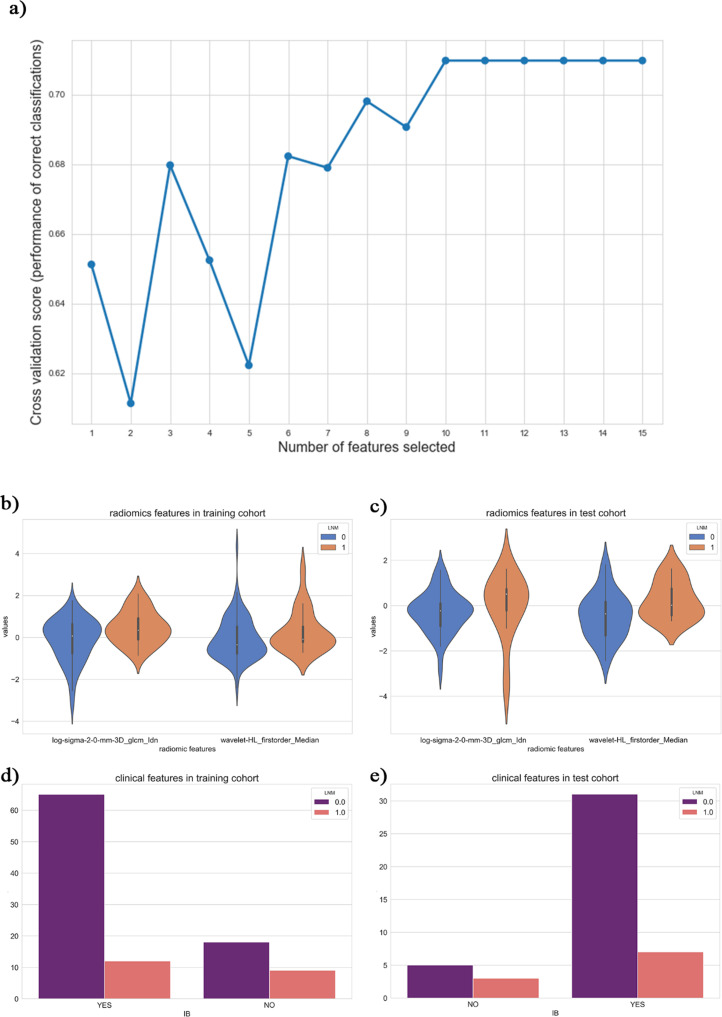
Figure 3.
(a) showed the model performance evaluated through the numbers of features as a function of the cross-validation feature recursive elimination algorithm. (b–e) Were statistical charts for the optimal subset of features. (b, c) Were violin-plots of radiomic features in the training cohort and test cohort, respectively. (d, e) Showed count-plots of clinical features in the training cohort and test cohort, respectively.

