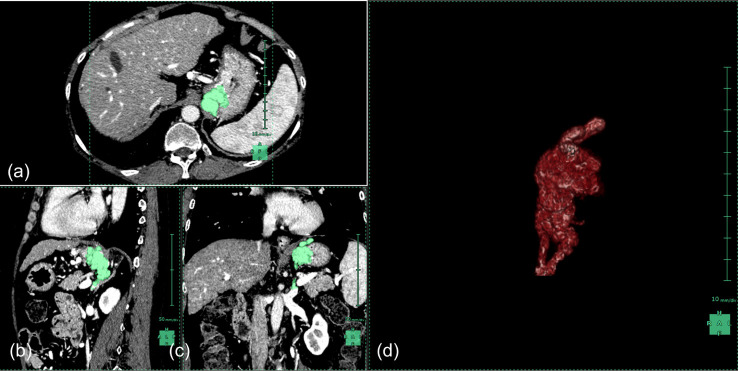
Figure 1.
Volumetry of gastric varices. Synapse Vincent was used for volumetric analysis. Areas in green represent traces of the gastric varices. MDCT scans are (a) axial, (b) sagittal, (c) coronal, and (d) a three-dimensional representation of the traces. The variceal volume of this patient is 26.9 ml. MDCT, multidetector row computed tomography.

