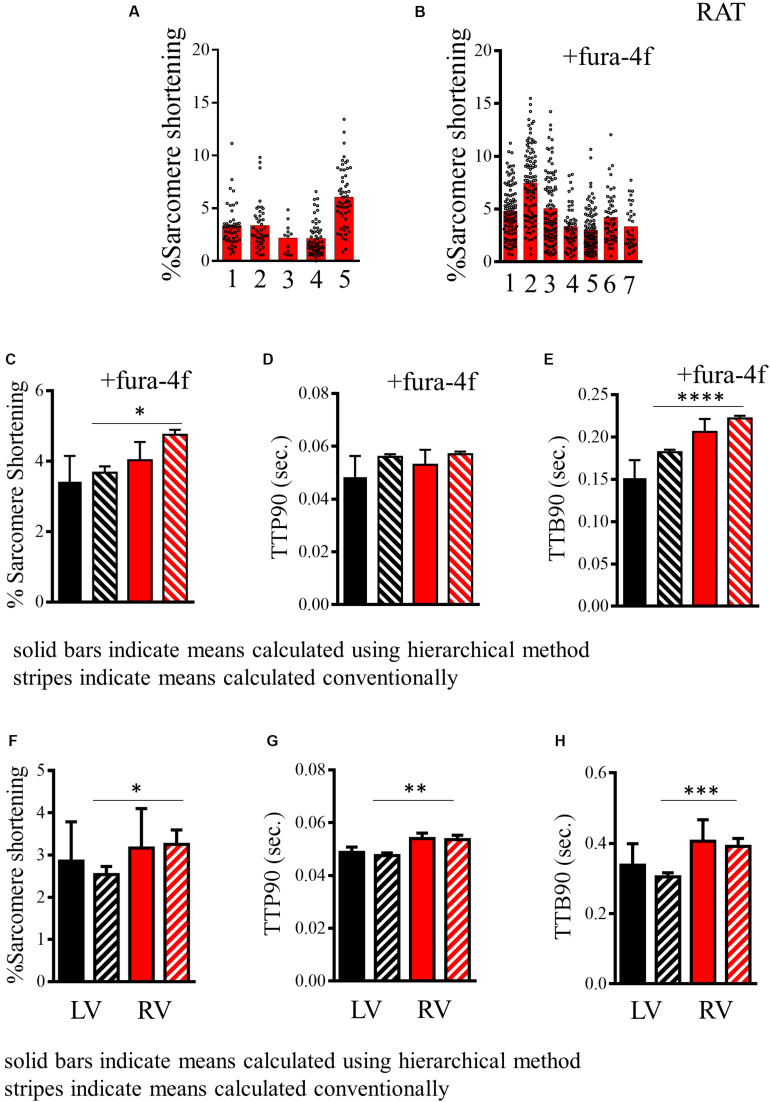
FIGURE 4.
Analysis of contractility of rat cardiomyocytes. (A,B) Histogram displaying measurements of the baseline sarcomere shortening of multiple individual preparations of rat cardiomyocytes without and with fura-4f loading. (C) Histogram comparing estimated mean and standard deviation of sarcomere shortening in the populations of rat cardiomyocytes presented in A (–Fura-4f black) and B (+Fura-4f red) with hierarchical structure included (solid bars) and assuming all measurements are independent samples (striped bars). (D) Histogram comparing estimated mean and standard deviation of TTP90 in populations of rat cardiomyocytes presented in Supplementary Figure 2C (–Fura-4f black) and D (+Fura-4f red) with hierarchical structure included (solid bars) and assuming all measurements are independent samples (striped bars). (E) Histogram comparing estimated mean and standard deviation of TTP90 in populations of rat cardiomyocytes presented in Supplementary Figure 2E (–Fura-4f black) and F (+Fura-4f red) with hierarchical structure included (solid bars) and assuming all measurements are independent samples (striped bars). (F) A representation of the estimated mean and standard error of sarcomere shortening of left and right ventricular cardiomyocytes isolated from mice. Datasets assuming a hierarchical structure (solid bars) and assuming no structure (striped bars). (G) Representations of the means and standard error of TTP90 of left and right ventricular cardiomyocytes isolated from mice with hierarchical structure (solid) and without (striped). (H) Representation of the means and standard error of TTB90 of left and right ventricular cardiomyocytes isolated from mice with hierarchical structure (solid) and without (striped).

