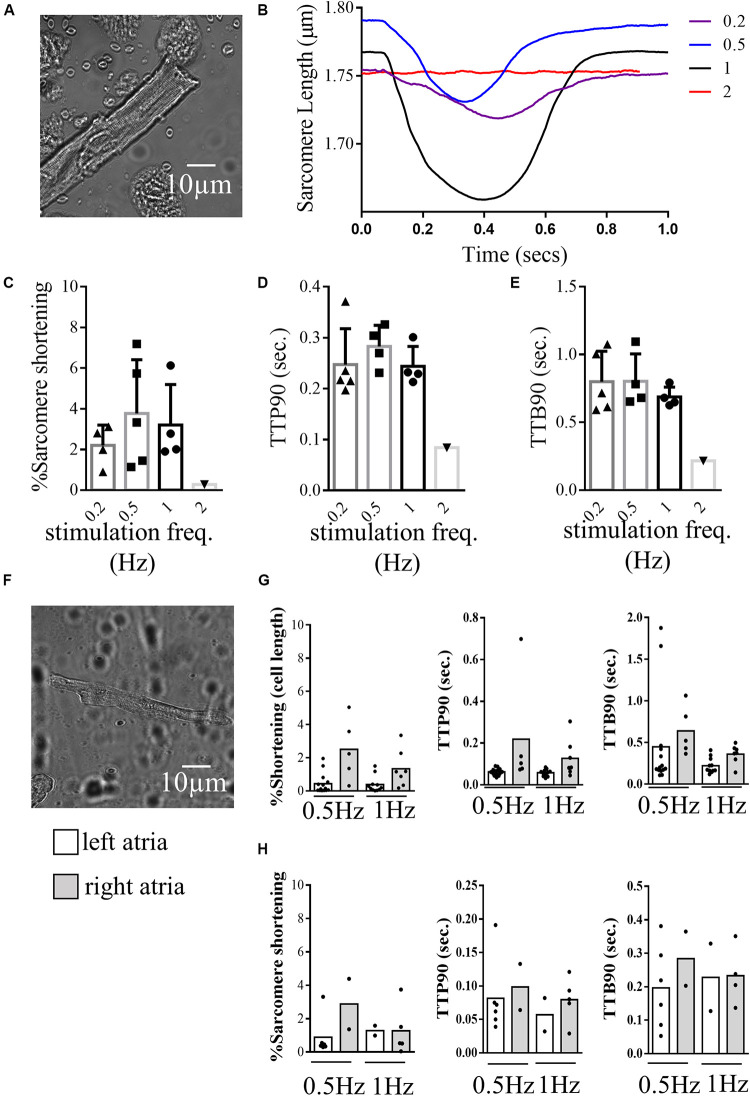
FIGURE 5.
Contractility of human cardiomyocytes. (A) Example image of a human ventricular cardiomyocyte isolated from the left ventricle of a patient with hypertrophic cardiomyopathy recorded during contraction analysis by the CytoCypher HTS. (B) Example traces of sarcomere shortening during the contraction cycle in the same cell paced at different frequencies. (C) Histogram and dot plots demonstrating the percentage sarcomere shortening of ventricular cells at different pacing frequencies. triangle = 0.2 Hz, square = 0.5 Hz, circle (line in bold) = 1 Hz inverted triangle = 2 Hz. (D) Histogram and dot plots demonstrating the TTP90 of sarcomere shortening of ventricular cells at different pacing frequencies. (E) Histogram and dot plots demonstrating the TTB90 of sarcomere shortening of ventricular cells at different pacing frequencies. (F) Example image of a human cardiomyocyte isolated from the left atrial chamber of a patient with hypertrophic cardiomyopathy. (G) Histogram and dot plots representing the cell shortening behaviors of cardiomyocytes isolated from the left and right atrial chambers of the same patient, paced at 0.5, and 1 Hz (% cell shortening, TTP90, and TTB90). clear bar = left atria and gray bar = right atria (H) Histogram and dot plots representing the sarcomere shortening behaviors of left and right atrial cardiomyocytes isolated from the left and right atria paced at 0.5 and 1 Hz (% sarcomere shortening, TTP90, and TTB90). clear bar = left atria and gray bar = right atria.

