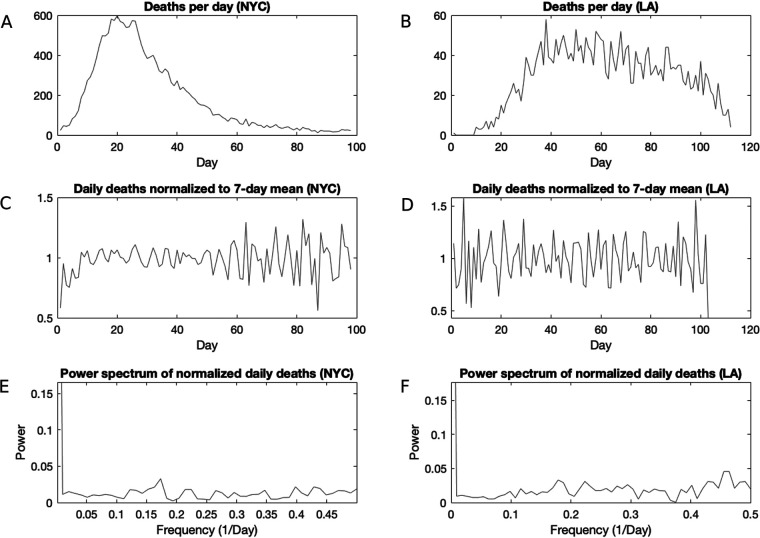
FIG 3.
Analysis of mortality data in NYC and LA. (A) Daily deaths in NYC; (B) daily deaths in LA; (C) daily deaths in NYC, normalized to a 7-day moving average; (D) daily deaths in LA, normalized to a 7-day moving average; E) power spectrum of the normalized mortality data in NYC, revealing no clear period; (F) power spectrum of daily deaths in LA, revealing no clear period.

