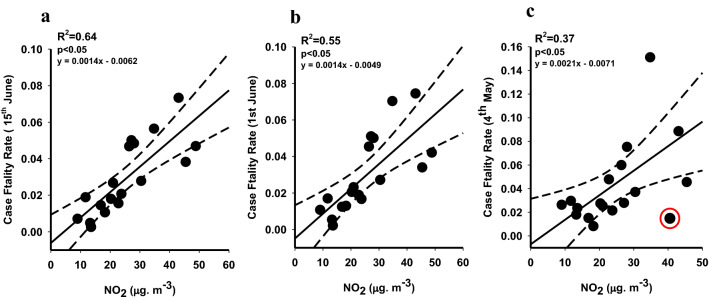
Fig. 3.
The variation in CFR on a 15th June, b 1st June and c 4th May with respect to varying atmospheric NO2 concentration (1 year average) in different 18 states of India (there is one outlier, marked in red). The annual average of this pollutant has been the average of the annual average obtained from all the stations in that state. Data has been collected from 196 stations of 123 cities in 18 states across India (obtained from the Central control room for air quality management- All India)

