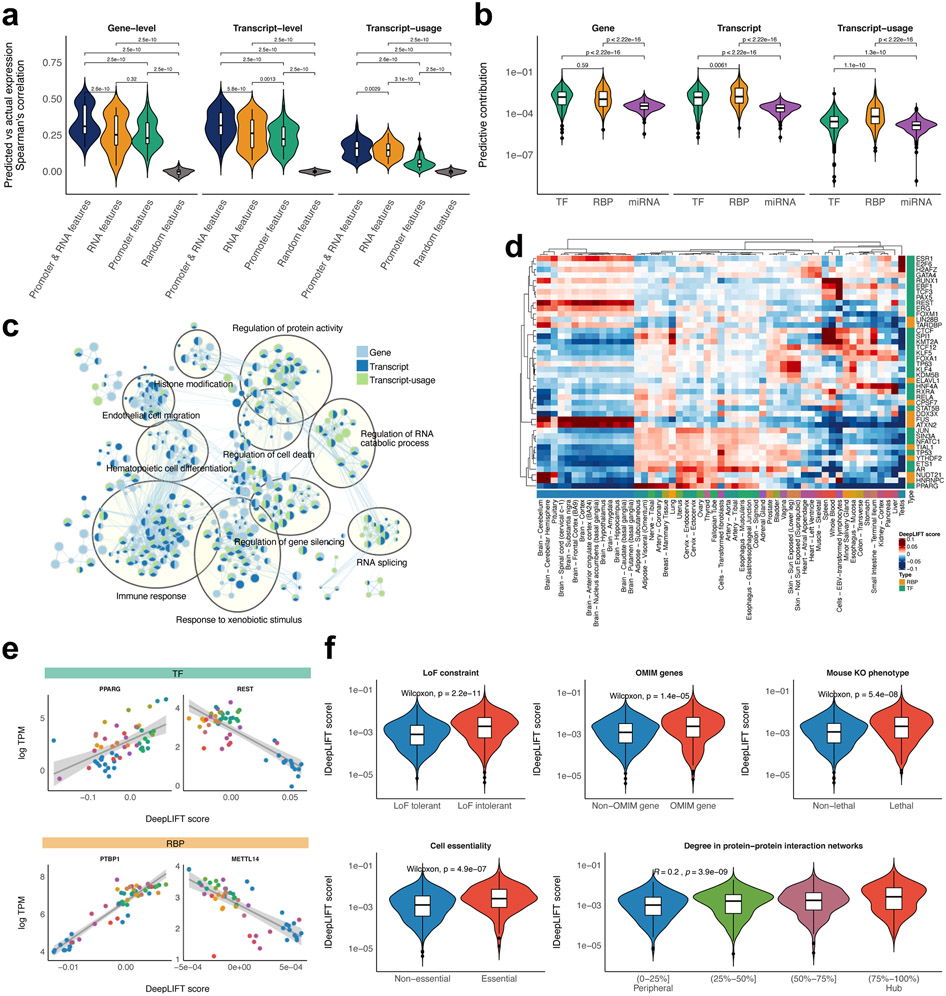
Figure 3.
Identification and characterization of key predictors. (a) The predictive performances of the models trained with a different set of features. The performances for the fold-change across 53 tissues were compared with the paired sample t-test. (b) Comparison of predictive contribution among classes of regulators. The regulator’s predictive contribution to the fold-change across 53 tissues was estimated based on DeepLIFT score. The two-sample Wilcoxon test was used to assess the statistical significance of the differential contribution. (c) GO enrichment map for key predictors. GO enrichment analysis for key predictors for the fold-change across 53 tissues was conducted using the pre-ranked GSEA. The significant associations (FDR<0.05) were visualized with green/blue node colours representing certain classes of regulators. (d) Key predictors for the tissue-specific transcriptomes. DeepLIFT scores of the top 5 key predictors in each tissue were displayed as a heatmap. (e) Example relationships between the predictive contributions of a regulator and its expression levels across tissues. A line of best fit based on linear regression was depicted with 95 percent confidence intervals. (f) The overlap between the key predictors for the fold-change across 53 tissues and LoF intolerant genes, OMIM genes, lethal genes in mice, essential genes in cell lines, hub proteins in protein-protein interaction networks.

