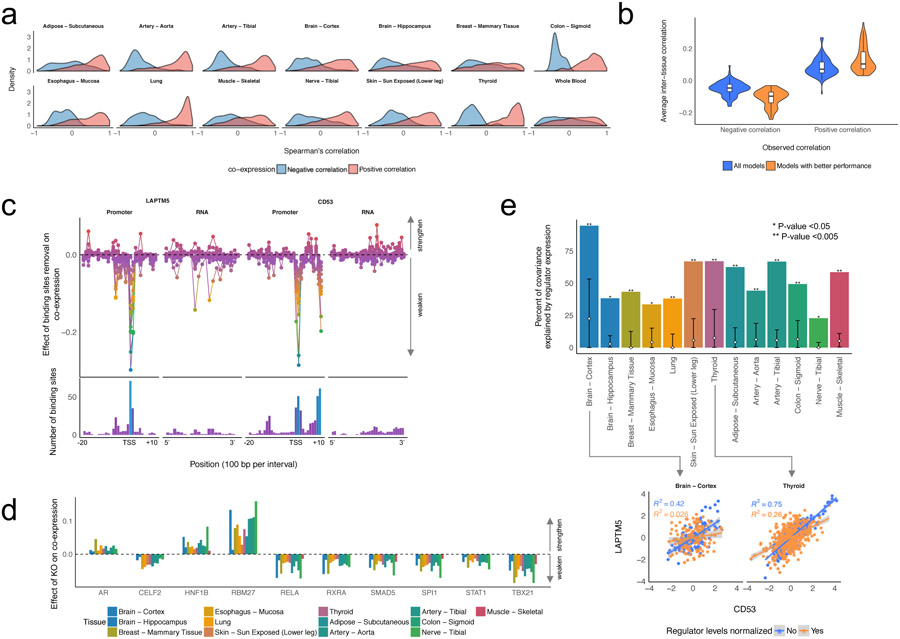
Figure 6.
Regulatory basis of gene co-expression relationships. (a) Co-expression relationships in the predicted gene expression. We defined the ground truth co-expression relationships as gene pairs with the absolute Spearman’s correlation greater than 0.7 in the actual testing data. The density of Spearman’s correlation between the co-expressed gene pairs in the predicted gene expression data was estimated based on the Gaussian kernel. (b) Inter-tissue gene co-expression relationships in the predicted gene expression. We defined the ground truth co-expression relationships as gene pairs with the absolute Spearman’s correlation greater than 0.5 in the actual test data. The violin plots show Spearman’s correlation of the inter-tissue co-expressed gene pairs based on the predictions from all models or the models whose performances on validation data were greater than 50% percentile in each tissue. (c) The effect of the binding site removal on co-expression between LAPTM5 and CD53. (d) The key regulators for the co-expression between LAPTM5 and CD53. (e) Percent of the co-expression relationship explained by the expression levels of the key regulators. The white diamond and the error bars in the bar indicated the average and 95% percentile of the percent of variance explained by randomly picked regulators, respectively. The scatter plots and linear regression lines show the effect of the key regulators on the co-expression.

