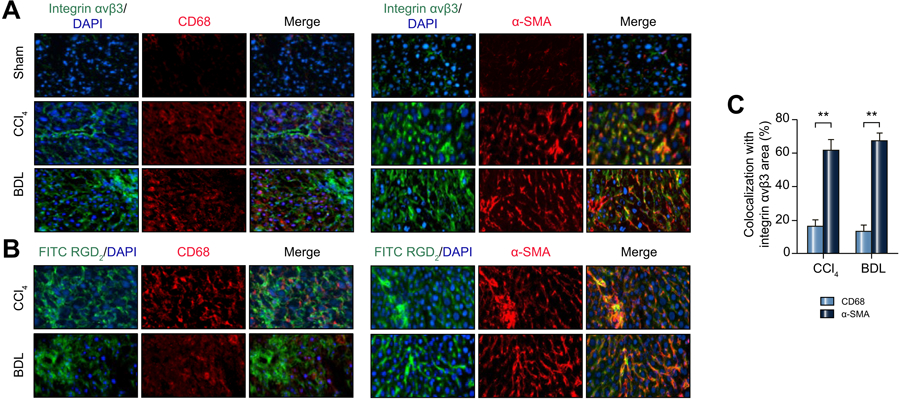
Figure 3: Distribution of αvβ3, CD68 and α-SMA with severe CCl4 and BDL fibrosis livers.

(A) Colocalization of integrin αvβ3 (green), CD68 (red) and α-SMA (red) by immunofluorescence in the CCl4 and BDL models. The merged images were obtained by overlaying the images of αvβ3, CD68 and α-SMA. (Original magnifications: 100X).
(B) Colocalization of FITC-RGD2 (green) with CD68 (red) and α-SMA (red) in the CCl4 and BDL models. (Original magnifications: 100X).
(C) Quantification of colocalization area of integrin αvβ3 with CD68 and α-SMA.
