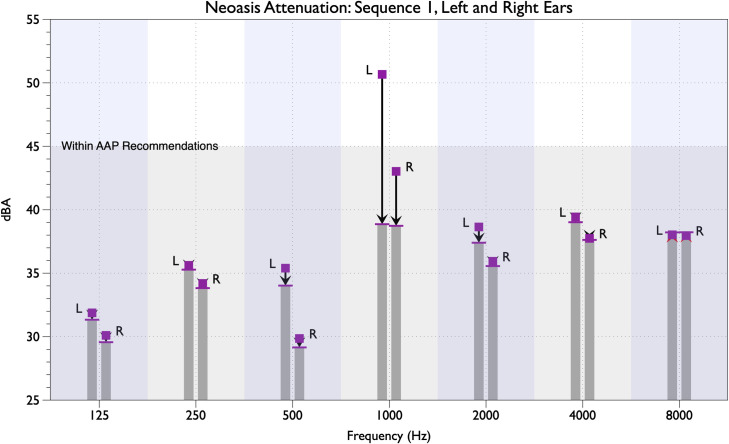
Fig 3. Noise attenuation for noise sequence 1 for both ears and seven octave bands.
The unattenuated SPL is indicaterd by the square mark and the attenuated SPL is indicated by the bar at the top of the column. Measurements for the left and right ears are indicated by the letters “L” and “R,” respectively. The shaded region on the lower portion of the graph indicates the level of the AAP guideline recommendations. The vertical shaded regions indicate each octave band.

