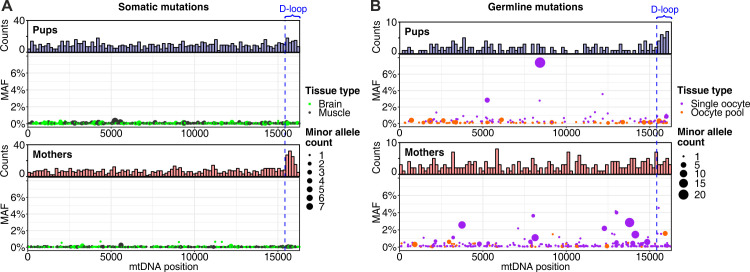
Fig 2. Mutations along the mtDNA molecule in pups and mothers.
Distributions of (A) somatic and (B) germline mutations along the mitochondrial genome. Dot size represents the number of molecules (i.e., the number of DCSs) in which a mutation was observed. The majority of mutations were found only in a single molecule; therefore, the shown MAF might be inaccurate in some samples. Among the mutations observed in at least two DCSs (for which MAF can be estimated more accurately), only 11 had MAF >1%—they all occurred in the germline (two mutations in single oocytes of pups, eight mutations in single oocytes of mothers, and one mutation in oocyte pool of a mother; S3 Table). The dashed blue line marks the beginning of the D-loop region. The raw data for the information depicted in this figure are available at https://github.com/makovalab-psu/mouse-duplexSeq. DCS, duplex consensus sequence; MAF, minor allele frequency; mtDNA, mitochondrial DNA.

