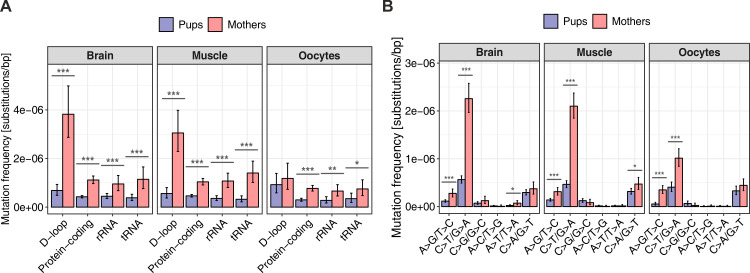
Fig 4. Mutation patterns in pups and mothers.
(A) Tissue-specific mutation frequencies (computed as total number of tissue-specific mutations divided by the product of mtDNA region length and mean DCS depth) for pups and mothers in different mtDNA regions: D-loop (877 bp), protein-coding (11,331 bp), tRNA (1,499 bp), and rRNA (2,536 bp) sequences. Mutation frequencies for noncoding sequences outside of the D-loop (57 bp) are shown in S6 Table. (B) Tissue-specific frequencies of different mutation types for pups and mothers. C>T/G>A mutations separated by CpG and non-CpG sites are shown in S8 Fig. Mutation frequency bars are shown with 95% Poisson confidence intervals. Differences between mothers and pups in each category were tested using the Fisher’s exact test; stars indicate p-values (*p < 0.05, **p < 0.01, ***p < 0.001). “Oocytes” comprise single oocytes and oocyte pools in both (A) and (B). The raw data for the information depicted in this figure are available at https://github.com/makovalab-psu/mouse-duplexSeq. CpG, 5′-cytosine-phosphate-guanine-3′; DCS, duplex consensus sequence; mtDNA, mitochondrial DNA.

