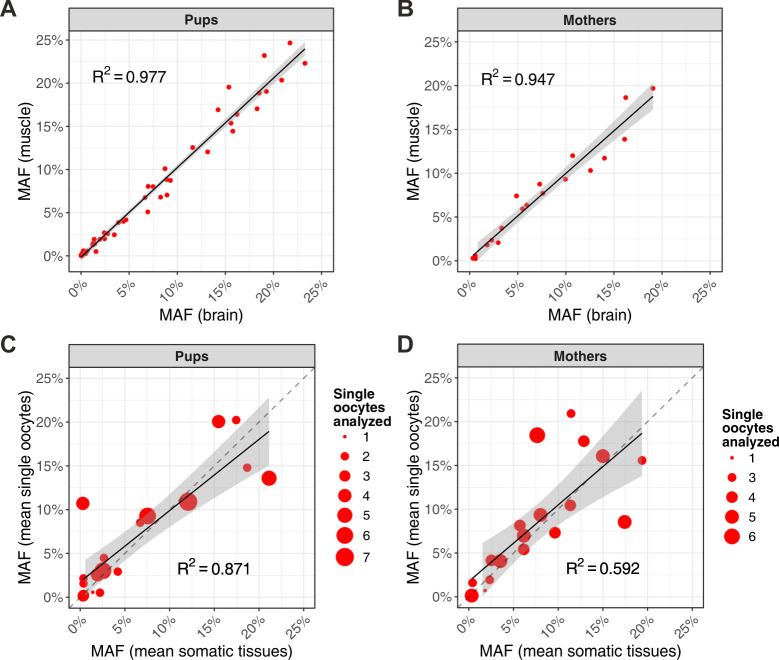
Fig 5. Correlations of allele frequencies for inherited heteroplasmies in somatic tissues and oocytes.
(A) MAF of heteroplasmies in brain versus muscle for pups. (B) MAF of heteroplasmies in brain versus muscle for mothers. (C) Mean MAF of heteroplasmies in single oocytes versus somatic tissues (averaged between brain and muscle) for pups. (D) Mean MAF of heteroplasmies in single oocytes versus somatic tissues (averaged between brain and muscle) for mothers. In (C-D), single oocytes (not oocyte pools) were used to obtain approximately equal numbers of oocytes for individual mothers and pups. Dot size indicates the number of sampled oocytes for each pup or for each mother. The gray bands on all plots represent confidence intervals around the regression line, and the dashed lines are the 1:1 relationship. The raw data for the information depicted in this figure are available at https://github.com/makovalab-psu/mouse-duplexSeq. MAF, minor allele frequency.

