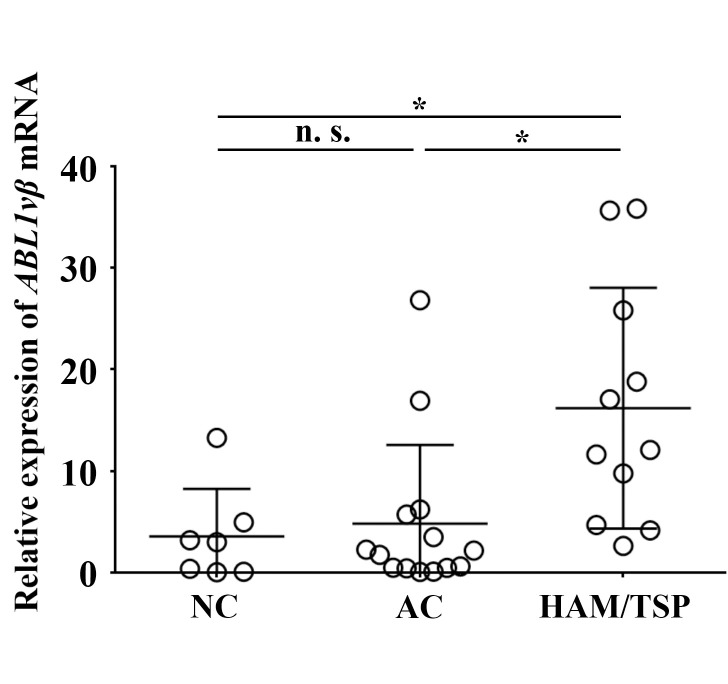
Fig 2. ABL1 gene expression in CD4+ T cells by quantitative RT-PCR.
The total RNA extracted from CD4+ T cells from the subjects including NC (N = 7), AC (N = 14), and HAM/TSP (N = 11) was reverse-transcribed. The relative expression levels of ABL1vβ mRNA were calculated by the comparative Ct method, and 100 ng cDNA of Jurkat cell line was used for the calibrator gene. GAPDH mRNA was used as an internal control. The relative mean expression level of ABL1 mRNA was 3.56 for NC, 4.83 for AC, and 16.19 for HAM/TSP group. Student’s t-test was used. Bars represent mean ± standard deviation (SD). *: significant at P < 0.05. n.s.: not significant.

