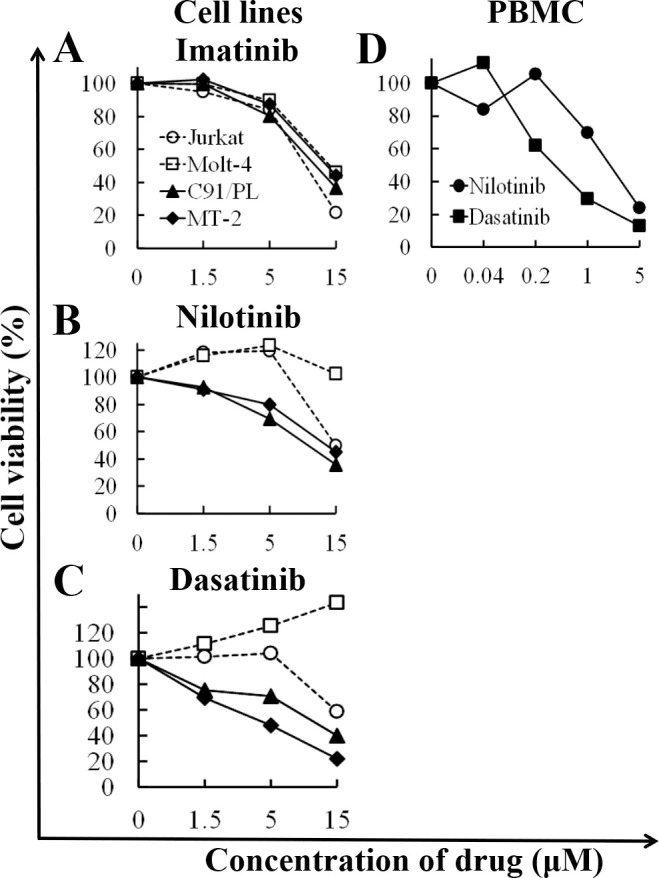
Fig 3. Viability of cell lines and HAM/TSP PBMC treated with ABL1 tyrosine kinase inhibitors (TKIs).

HTLV-1-uninfected cell lines (Jurkat and Molt-4), HTLV-1-infected cell lines (C91/PL and MT-2), and PBMC from a HAM/TSP patient were cultured with various concentrations of TKIs for 48 h. Cell viability was measured by an XTT assay in triplicate. A: viability of cell lines treated with imatinib. B: viability of cell lines treated with nilotinib. C: viability of cell lines treated with dasatinib. D: viability of HAM/TSP PBMC treated with TKIs (nilotinib or dasatinib). X- and y-axis show the concentration of TKIs (μM) and cell viability (%), respectively. Cell viability (%) represents the live cell number treated with TKIs relative to that without treatment. Open circle: Jurkat; open square: Molt-4; solid triangle: C91/PL; solid diamond: MT-2; solid circle: nilotinib; and solid square: dasatinib.
