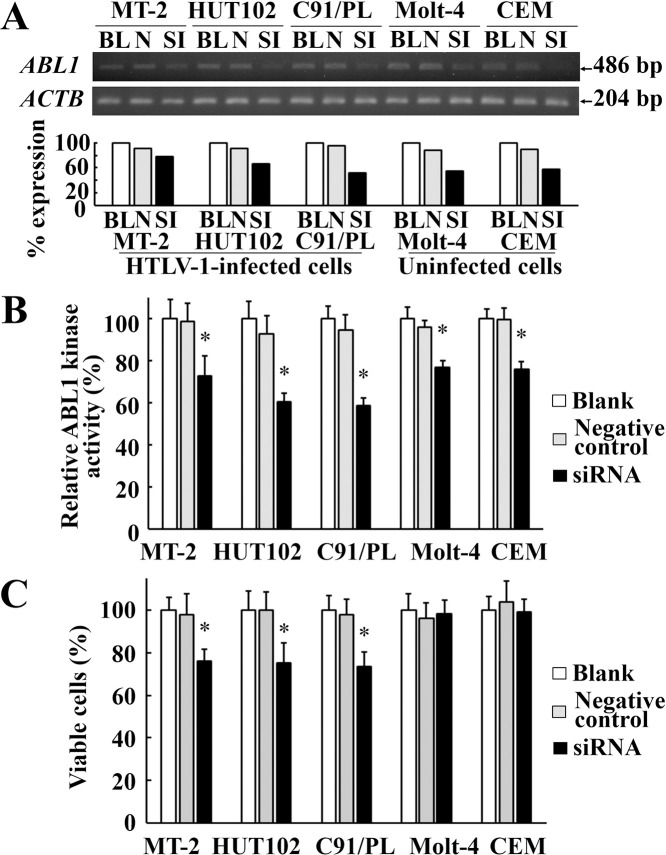
Fig 6. ABL1 mRNA knockdown by siRNA in HTLV-1-infected or uninfected cell lines.
A: RT-PCR of HTLV-1-infected or uninfected cell lines after ABL1 siRNA transfection. Upper and lower gel images represent amplicon of ABL1 mRNA and ACTB mRNA, respectively. The bar graph under the gel images indicates relative expression of ABL1 mRNA standardized by ACTB mRNA. BL, N, and SI represent blank control, negative control siRNA, and ABL1 siRNA, respectively. B: Relative ABL1 tyrosine kinase activities of HTLV-1-infected or uninfected cell lines after ABL1 siRNA transfection. Grey and solid bars indicate the relative ABL1 kinase activities in each cell line treated with negative control siRNA or ABL1 siRNA to those without siRNA treatment (white bars), respectively. Error bars represent SD. Asterisks indicate statistically significant (P < 0.05, paired t-test) when compared with those treated with negative control siRNA (gray bars). C: Cell viabilities of HTLV-1-infected or uninfected cell lines after ABL1 siRNA transfection. Grey and solid bars represent the relative percent of viable cells in each cell line treated with negative control siRNA or ABL1 siRNA to those without siRNA treatment (white bars), respectively. Error bars represent SD. Asterisks indicate statistically significant (P < 0.05, paired t-test) when compared with those treated with negative control siRNA (gray bars).

