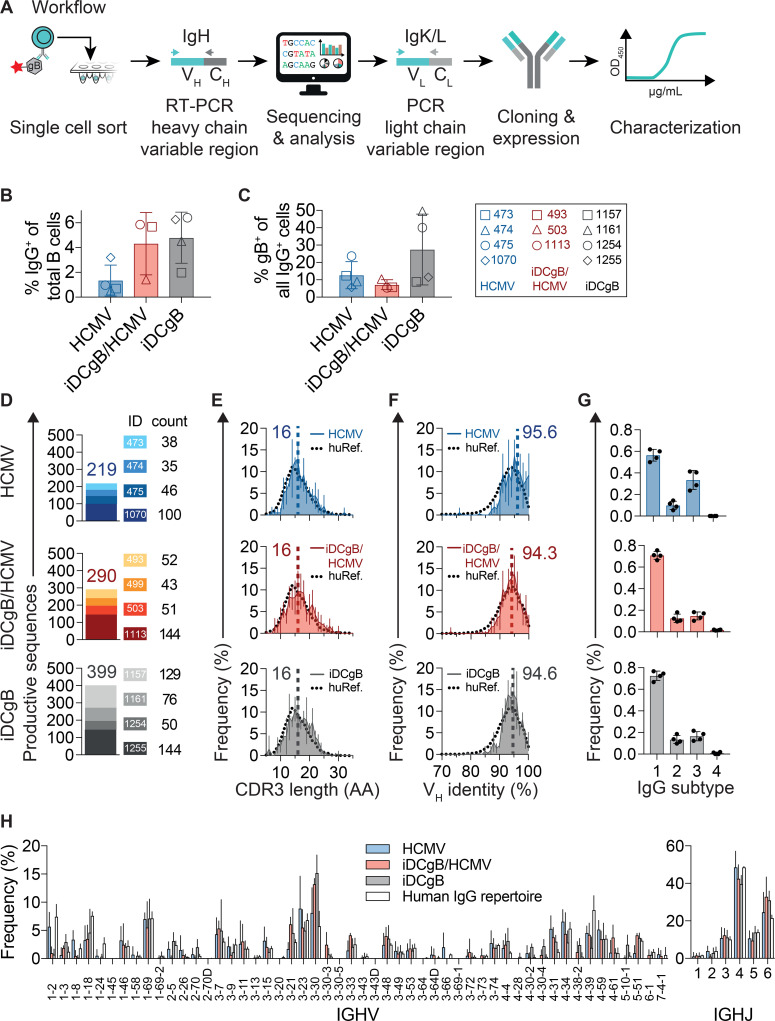
Fig 4. Single B cell sorting followed by IgG sequencing revealed a broad B cell response.
A) Schematic representation of single cell sorting, PCR amplification of the IgG sequences, monoclonal antibody cloning and characterization workflow. Single gB-binding B cells were sorted into 96 well plates (gating strategy is shown in S3 Fig). Reverse transcription (RT) and heavy chain PCR amplification were performed at the single cell level. Products were sequenced by Sanger sequencing and annotated with IgBLAST for analysis. Selected light chains (Kappa or Lambda, i.e. IgK/L) were amplified by PCR, sequenced and annotated. Variable heavy (VH) and variable light (VL) chain pairs were sub-cloned into plasmids and recombinantly expressed in transfected HEK293-6E cells for functional characterization. Human reference data was taken from Erhardt et al. B) Frequency (% positive cells) of sorted IgM-/IgG+ B cells recovered for splenocytes obtained from HCMV (blue, n = 4), iDCgB/HCMV (red, n = 3) and iDCgB (grey, n = 4) cohorts. Error bars indicate standard deviation of the mean. C) Frequency (% positive cells) of gB-binding IgM-/IgG+ B cells is depicted (for each cohort as shown in b). Standard deviation of the mean is indicated. D) Numbers of quality-controlled and productive VH sequences amplified by nested-PCR. Each mouse identity (ID) is represented in a different color code and numbers of productive sequences obtained per mouse and per group are indicated. E) CDRH3 amino acid (AA) length distribution for all sequences per group. F) Mean VH germline identity (%) distribution for all sequences per group. Error bars in e) and f) depict standard deviations of the mean, dashed vertical lines and numbers indicate the median AA length and median VH germline identity, respectively. Human reference (huRef) distributions are indicated as black dotted lines. G) Distribution of IgG subtypes (1, 2, 3, 4) for all sequences per cohort. H) Mean IGHV and IGHJ gene segment usage for HCMV, iDCgB/HCMV, iDCgB cohorts and a human reference IgG repertoire. Error bars depict standard deviations of the mean. Human IgG repertoire reference (huRef) data in e), f), and h) was calculated using whole IgG NGS data from n = 4 healthy humans.

