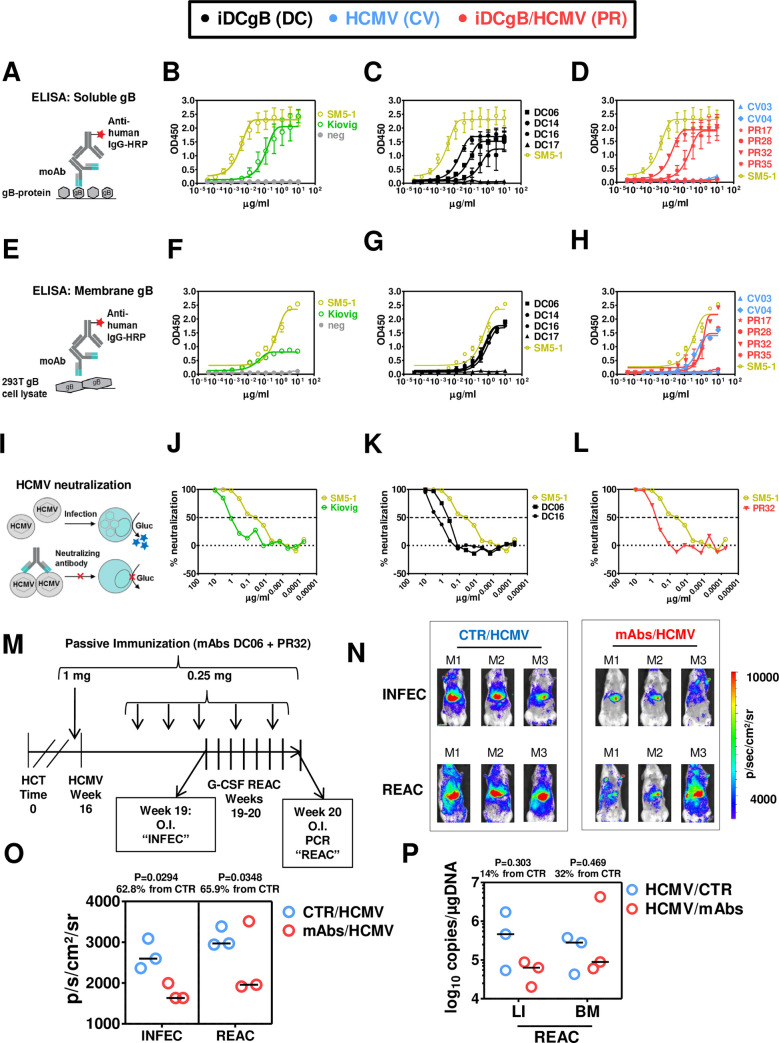
Fig 5. Functional assessment of cloned monoclonal antibodies to bind to HCMV-gB and to neutralize HCMV in vitro.
A) Scheme of ELISA assay using wells coated with recombinant gB protein. Monoclonal IgGs were serially diluted, transferred to wells and immune detection was performed with an HRP-conjugated antibody against human IgG. Assays were performed in duplicate independent experiments and the results were merged for plotting the data. B) OD450 measurements for reference SM5-1 monoclonal IgG (orange), Kiovig pooled IgG (green) and negative control (grey). C) OD450 measurements for monoclonal IgGs derived from iDCgB immunized mice (black) are shown. SM5-1 was included as a reference (orange). D) OD450 measurements for monoclonal IgGs derived from HCMV (blue) and iDCgB/HCMV (red) cohorts are shown. SM5-1 was included as a reference (orange). E) Scheme of ELISA assay using wells coated with protein lysates from 293T/gB cells. Monoclonal IgGs were serially diluted, transferred to wells and immune detection was performed with an HRP-conjugated antibody against human IgG. Assays were performed in duplicate independent experiments and the results were merged for plotting the data. F) OD450 measurements for reference SM5-1 monoclonal IgG against HCMV gB (orange), Kiovig pooled IgG (green) and negative control (grey). G) OD450 depicted for monoclonal antibodies derived from iDCgB immunized (black) cohort. SM5-1 (orange) measurement was included as a reference. H) ELISA (OD450) measurements for monoclonal IgG derived from HCMV (blue) and iDCgB/HCMV (red) cohort. SM5-1 (orange) was included as reference. For F) G) H) Wells coated with protein lysates obtained from control 293T/w.t. cells were included in the ELISA assay as negative control. No cross-reactivity was detectable. I) Scheme of the in vitro neutralization assay. Antibodies were serially diluted and incubated with HCMV prior to infection. TB40-GLuc viruses were pre-incubated with the antibodies for 1 h and MRC-5 cells were infected with the virus-antibody mixture. Spinoculation was performed and 1h later medium was exchanged. The catalytic activity of the secreted GLuc signal was measured in the supernatant 24h later by luminometry as relative light units (RLU). The experiment was performed as independent duplicates and the results were merged. The % neutralization (y-axis) was plotted against the log10 μg/ml antibodies (x-axis), the neutralization curves were adjusted after non-linear regression analyses and the IC50 values were calculated (Table 1). J) % neutralization of HCMV by the reference SM5-1 IgG (light green) and Kiovig polyclonal antibodies (dark green). Infected MRC-5 cells not exposed to the mAbs were included for RLU measurements and used as 100% infection reference (Mock, grey). K) % neutralization of HCMV by mAbs DC06 and DC16 derived from the iDCgB cohort (black). SM5-1 IgG (light green) is shown as reference. L) % neutralization of HCMV by the mAb PR32 derived from a HCMV-protected mouse of the iDCgB/HCMV cohort (red). SM5-1 IgG (light green) is shown as reference. The other six cloned antibodies (DC14, DC17, CV03, CV04, PR17, PR28 and PR35) did not neutralize HCMV infection. All assays were performed in duplicate independent experiments. For ELISA and neutralization assays, measurements were taken for two and four wells, respectively. For all graphs error bars indicate standard deviation of the mean and corresponding EC50 and IC50 values are shown in Table 1. M) Schematic representation of the experiment to test the effects of passive immunization by adoptive antibody transfer against HCMV. For the control group, mice were infected with HCMV 16 weeks after HCT and G-CSF treatment was performed between weeks 19 and 20 after HCT. For the passive immunization cohort, mice were injected i.v. with the monoclonal antibodies (DC06 and PR32, 0.5 mg each in total 1.0 mg) on the day prior to HCMV infection. After infection, the mice were injected i.v. with the monoclonal antibodies (DC06 and PR32, 0.125 mg each in total 0.25 mg) additional seven times. N) Optical imaging analysis performed for the control HCMV cohort (left) or the cohort treated with mAbs (D06 and PR32) to test the effects of passive immunization against HCMV infection (top, “INFEC”) and after HCMV reactivation induced by G-CSF treatment (bottom, “REAC”). All mice were analyzed with the same settings; the range of the bio-luminescence signals is indicated by the colored bar on the right side (radiance: p/sec/cm2/sr). O) Quantified total Flux (phonons/second, p/s) for the control (CTR/HCMV, blue) or mAb-treated cohort (mABs/HCMV, red). ROI was quantified for the frontal torso and abdomen and kept constant for all mice. Data was obtained for the two time points to monitor INFEC (left) and REAC (right). P) Quantification of HCMV viral copies (log10 copies/μg DNA) detected in liver (LI) and bone marrow (BM) comparing HCMV-infected mice (blue) and mice treated by with mAbs (red). The horizontal bars in black indicate the median values for each cohort and time of analyses. The P values were determined by t-Test. The % increase is relative to the CTR non-treated cohort (see S10 Table).

