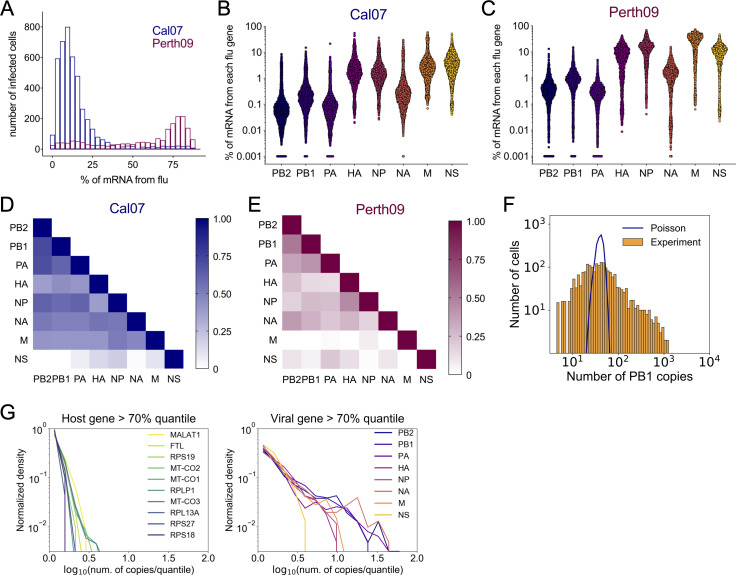
Fig 2. Enormous heterogeneity in viral gene expression patterns.
(A) Distributions of Cal07 and Perth09-infected A549 cells, binned by the fraction of total cellular poly(A) RNA that is viral in origin. (B) Plots show the fraction of total poly(A) RNA per cell that maps to the indicated viral gene segment of Cal07. Each dot represents a single cell, cells with no detectable reads mapping to the indicated segment were arbitrarily assigned a value of 0.001 to show up on the log10 scale. (C) Same figure as (B) for Perth09. (D) R2 correlation values plotted as heat map for all pairwise comparisons of Cal07 viral transcripts within infected cells positive for all viral genes. (E) Same figure as (D) for Perth09. (F) Distribution of normalized Cal07-PB1-derived reads per cell (orange) compared with a Poisson distribution of equal mean (blue line) on a log-log scale. (G) Distributions of top 10 most abundant host transcripts (left panel) and Cal07 viral gene expression (right panel) normalized by the 70th quantile on a log-log scale.

