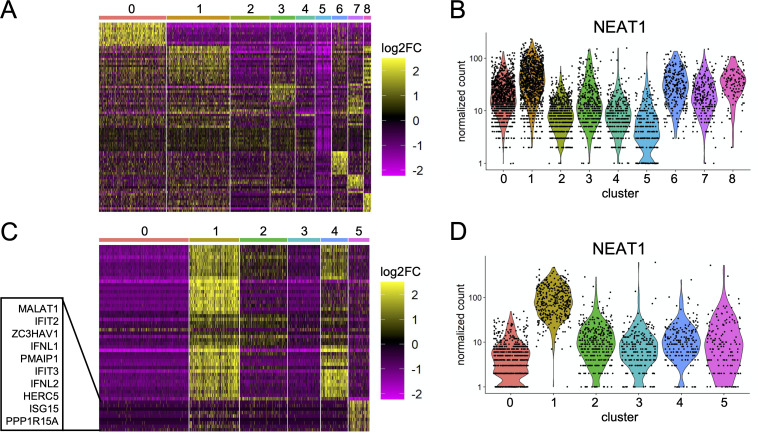
Fig 4. Substantial virus strain-specific variation in the expression patterns of critical determinants of IAV infection outcome.
(A) Heat map showing differential expression of the top 10 characteristic host genes for each cluster of Cal07-infected cells (from Fig 3A). Individual cells are each represented by a column, grouped by cluster, with individual rows representing relative expression of the top 10 specific host transcripts most significantly (lowest p values) associated with each cluster. (B) Comparison of normalized per cell counts of NEAT1 between clusters of Cal07-infected cells shown in (A). (C) Same heat map as (A) for each cluster from Perth09-infected cells (From Fig 3D), with the top 10 genes defining cluster 5 highlighted. (D) Comparison of normalized per cell counts of NEAT1 between clusters of Perth09-infected cells shown in (C).

