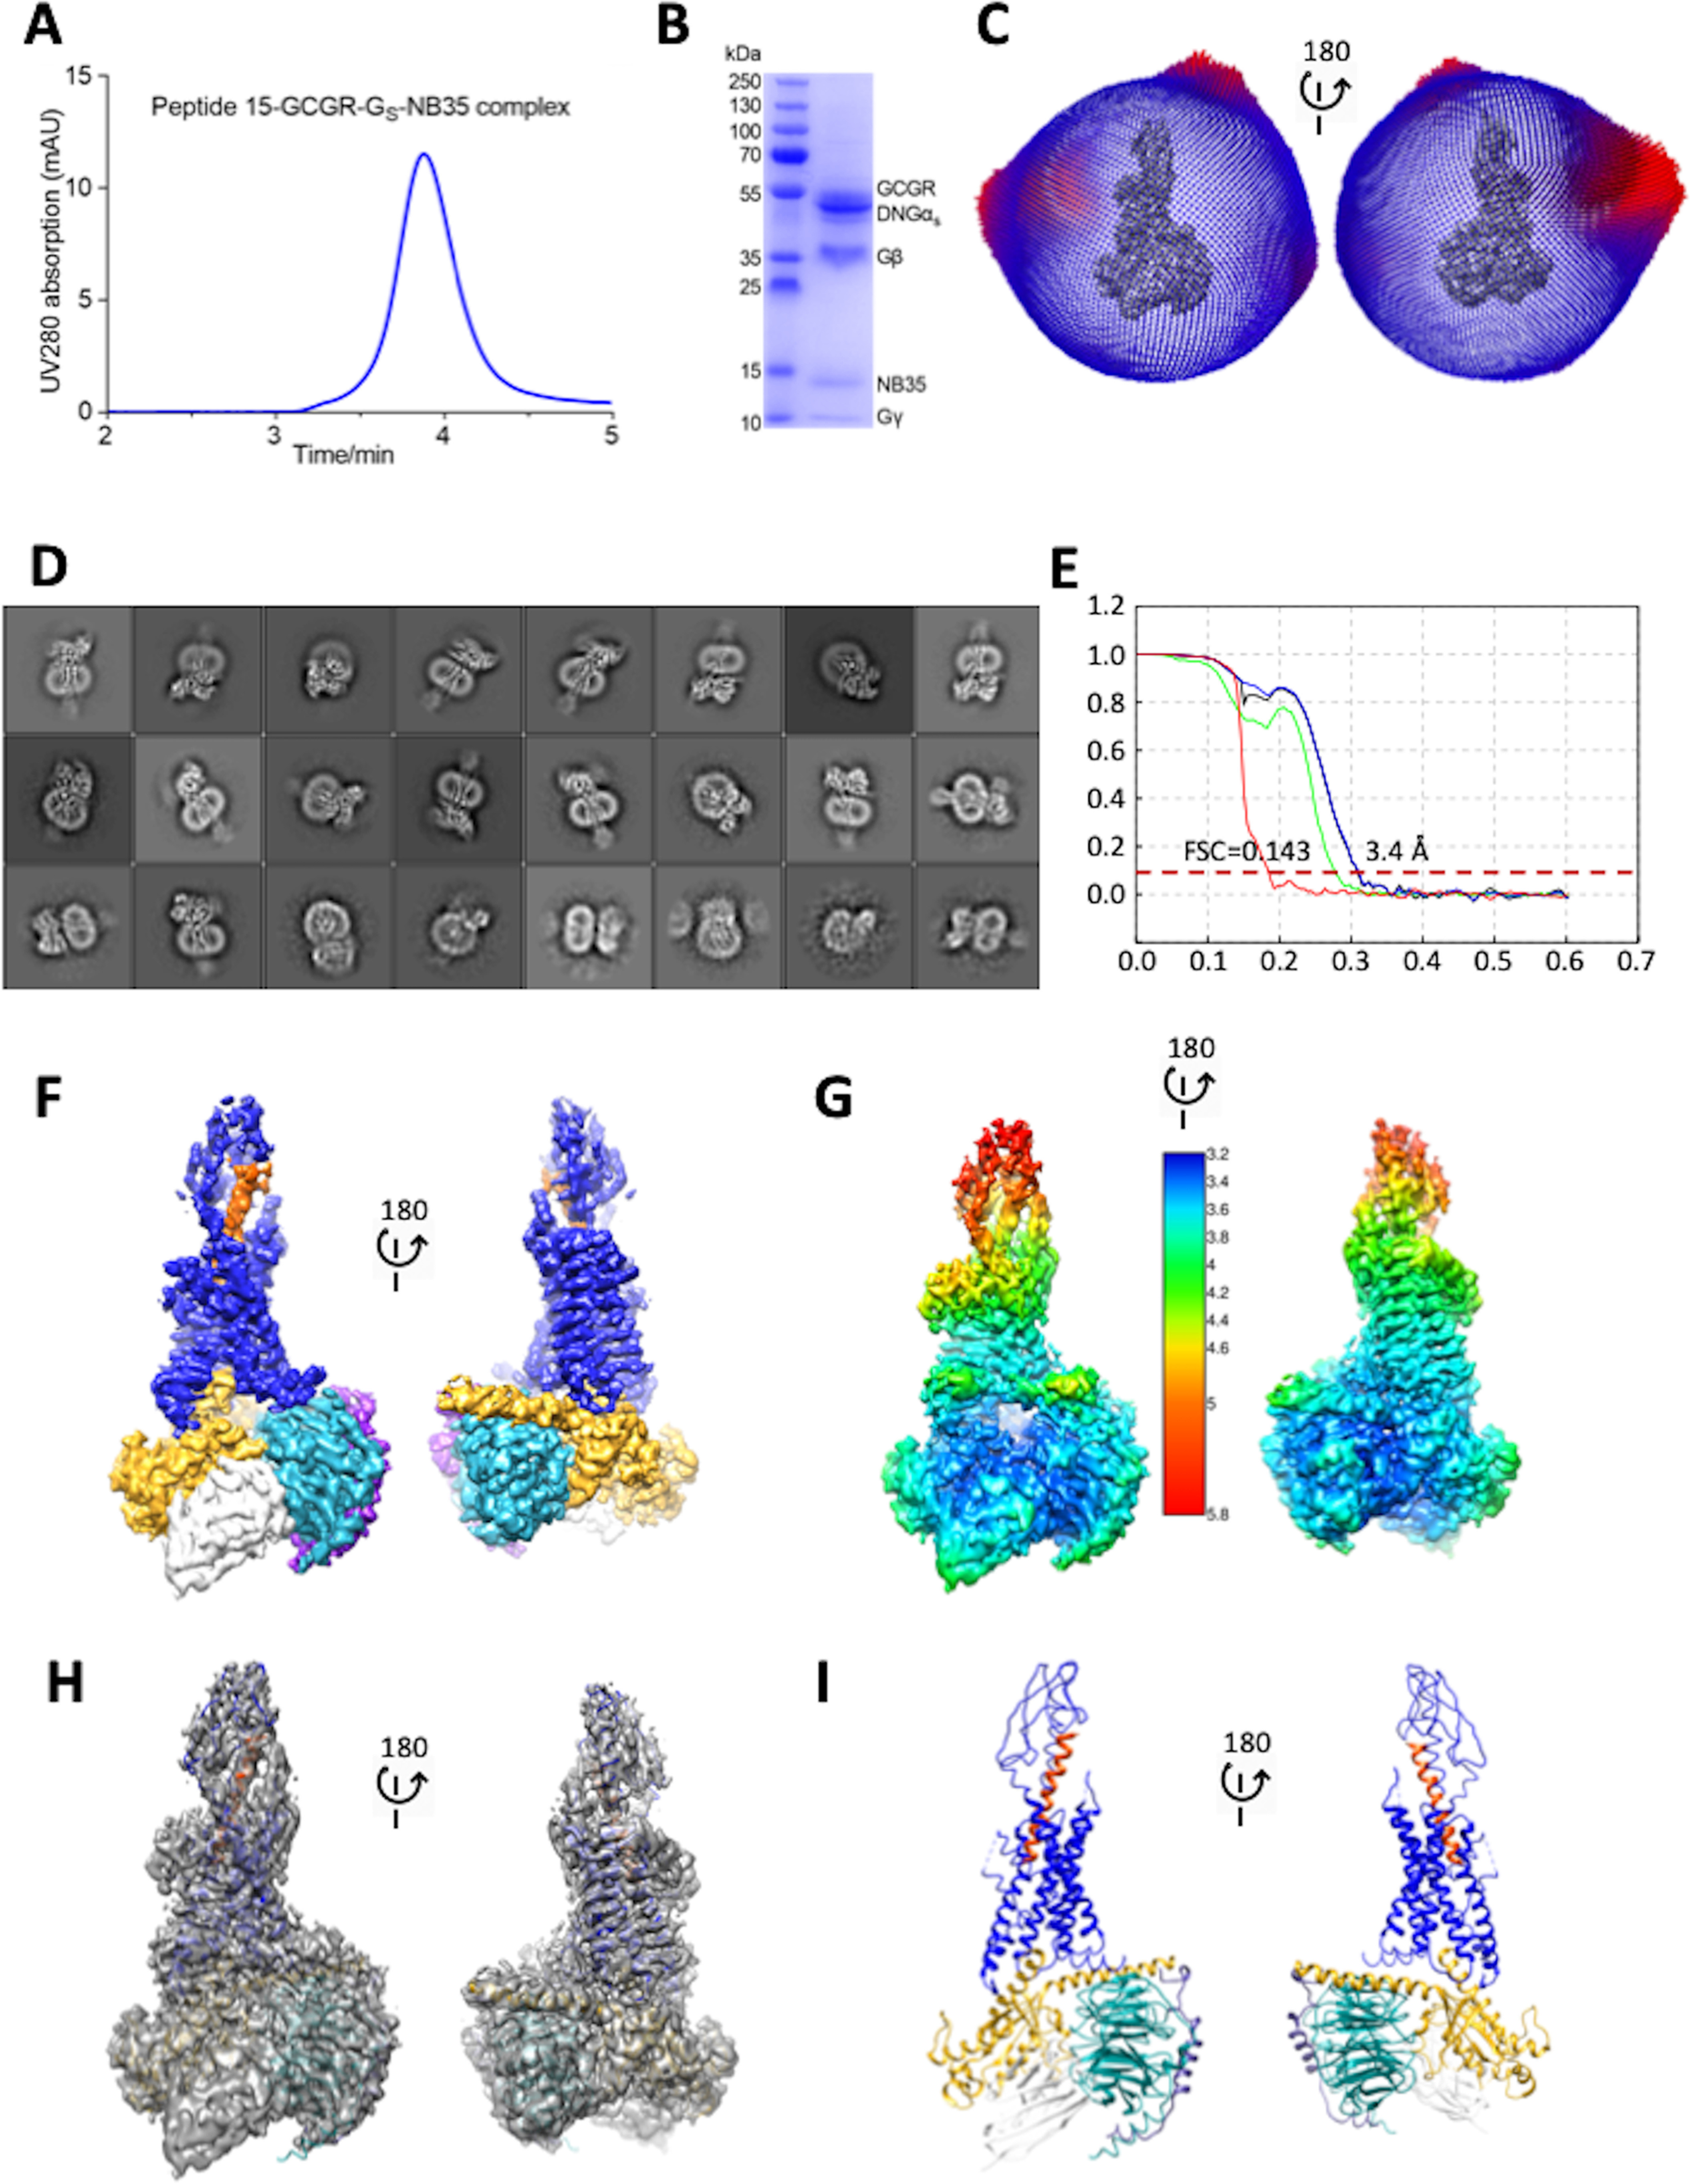
Figure 1.

Cryo-EM structure of the P15-GCGR-GsDN-Nb35 complex. A, analytical SEC trace of the purified complex. B, Coomassie blue–stained SDS-PAGE of the purified complex. C, 3D histogram representation of the Euler angle distribution of all the particles used in the reconstruction overlaid on the density map drawn on the same coordinate axis. D, 2D class averages of cryo-EM projections of the receptor complex. E, gold standard Fourier shell correlation (FSC) curves for the final map and map validation from half maps, showing the overall nominal resolution of 3.4 Å. F, surface representation of the final map colored by protein segment. G, local resolution-filtered EM map displaying local resolution (Å) colored from highest resolution (dark blue) to lowest resolution (red). H, full map containing the backbone model of the complex in ribbon format. I, backbone model of the receptor complex in ribbon format. Blue, GCGR; orange, P15; gold, Gαs; cyan, Gβ1; purple, Gγ2; white, Nb35.
