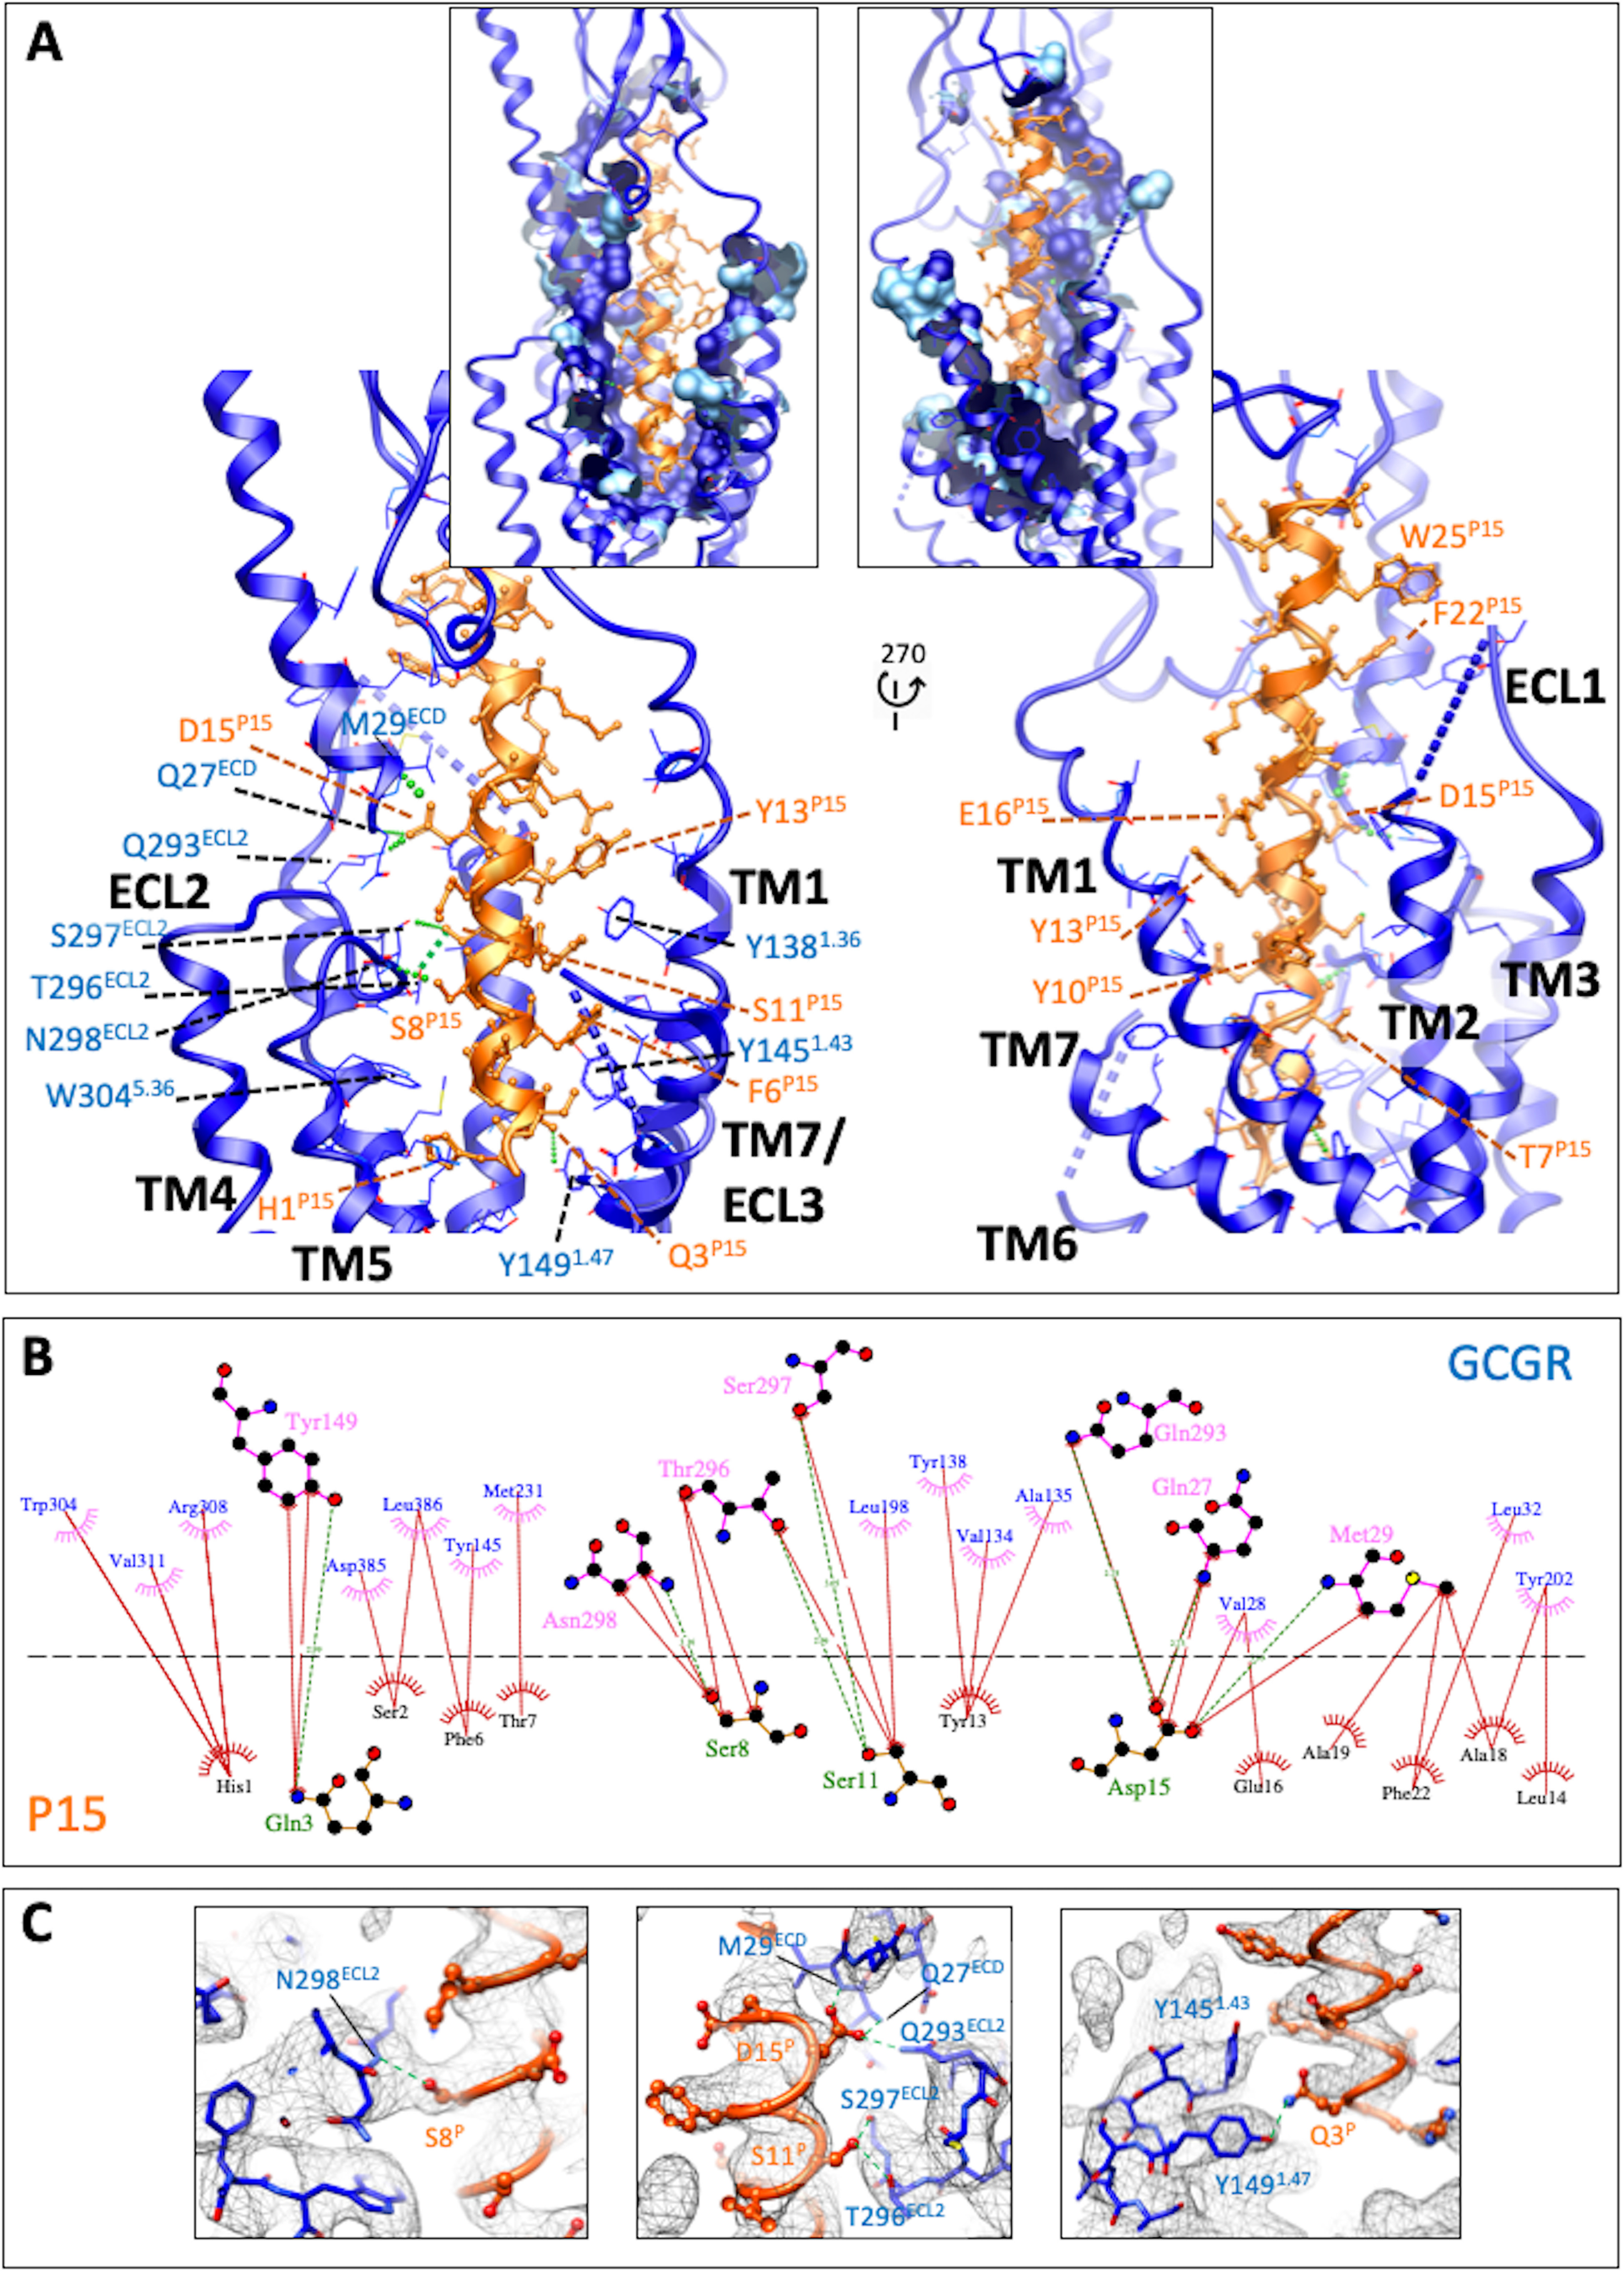
Figure 2.

The peptide 15-binding interface with GCGR. A, GCGR (blue) residues within 5 Å of P15 are displayed in wire format with the GCGR protein backbone in ribbon format. Blue dashed lines represent segments of GCGR that could not be modeled because of ambiguous density. P15 is colored orange with amino acid side chains in x-stick format and backbone shown as ribbon display. H-bonds are displayed as dashed green lines. The insets include surface display of interacting GCGR residues with the dark blue–colored surface illustrating the proportion of the side chain within 5 Å. B, interactions were determined using LigPlot+. GCGR residues are located above the dashed black line, and P15 residues below the line. Hydrophobic interactions are illustrated by red (P15) or pink (GCGR) arcs, and interacting residues are joined by a red line. Amino acids involved in H-bonds are shown in atomic detail with H-bonds shown as dashed green lines. C, map to model densities for side chains involved in H-bond (green dashed lines) formation.
