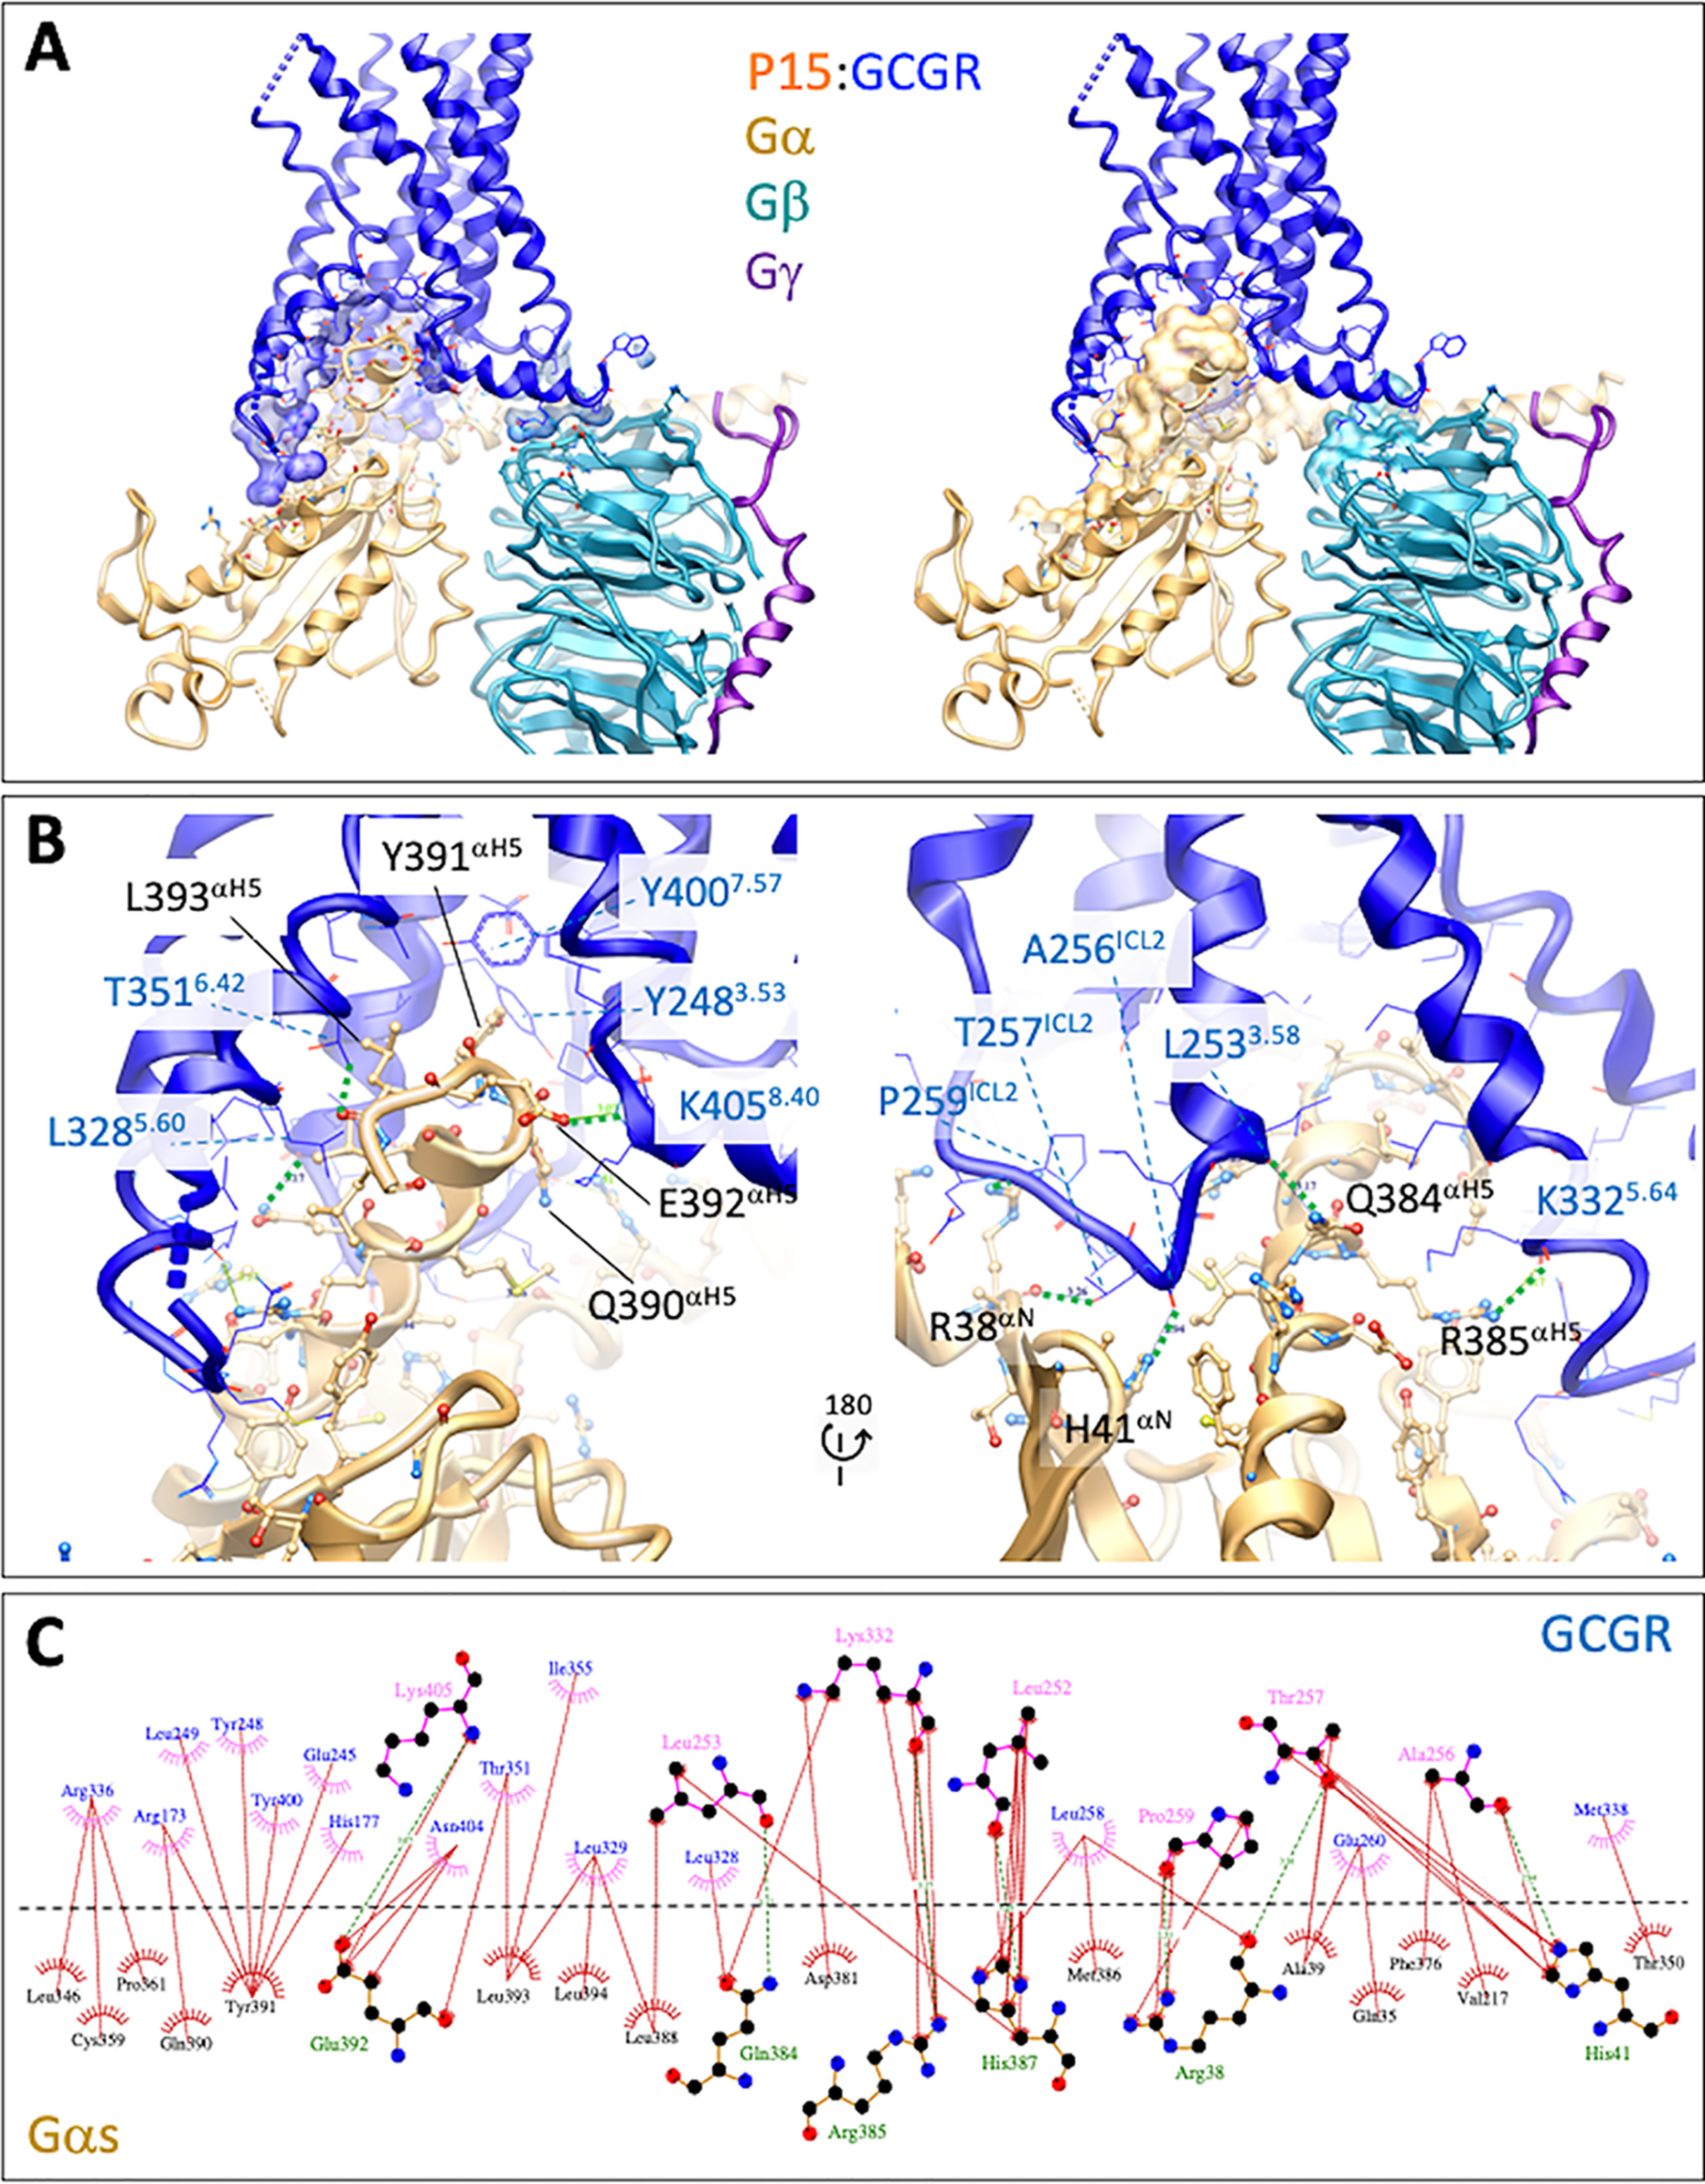
Figure 4.

The GCGR-Gs protein interface of the active P15-bound complex. A, overview of the interface with protein backbones displayed in ribbon format and side chains within 5 Å displayed in either x-stick (G protein) or wire (GCGR) format. Left panel includes surface representation of the interacting GCGR residues. Right panel includes surface representation of the interacting G protein residues. GCGR, blue; Gαs, gold; Gβ1, cyan; Gγ2, purple. B, close up of the Gαs-GCGR interface. Predicted H-bonds are displayed as green dashed lines. C, GCGR-Gαs interface. Interactions were determined using LigPlot+. GCGR residues are located above the dashed black line, and Gαs residues below the line. Hydrophobic interactions are illustrated by red (Gαs) or pink (GCGR) arcs, and interacting residues are joined by a red line. Amino acids involved in H-bonds are shown in atomic detail with H-bonds shown as dashed green lines.
