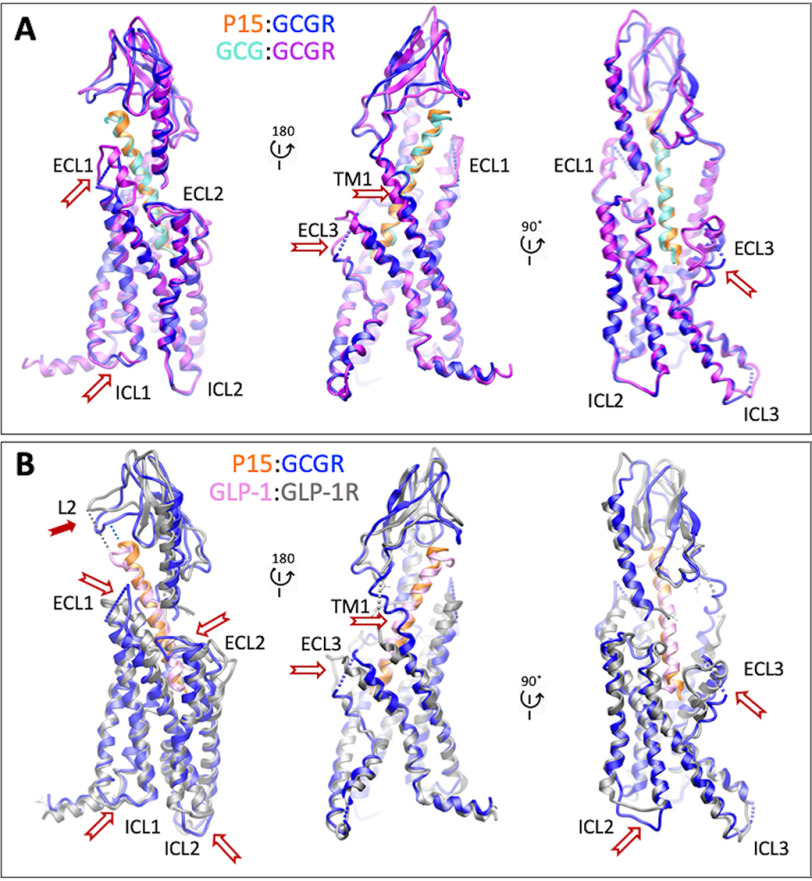
Figure 5.
A and B, comparison of the active P15-GCGR-GsDN-Nb35 complex with GCG-GCGR-GsDN-Nb35 (A, PDB: 6LMK) and GLP-1-GLP1R-GsDN-Nb35 (B, PDB:,5VAI) complexes. Protein backbone is shown in ribbon format. Only the receptor and peptides are displayed for clarity. GCGR is blue and P15 orange in the P15-GCGR complex. GCGR is purple and GCG light blue in the GCG-GCGR complex. GLP-1R is gray and GLP-1 pink in the GLP-1–GLP-1R complex. White arrows depict areas of conformational divergence between the complexes. The solid red arrow highlights the differential positioning of the L2 loop of the GCGR and GLP-1R ECDs relative to the C terminus of peptides.

