Figure 6.
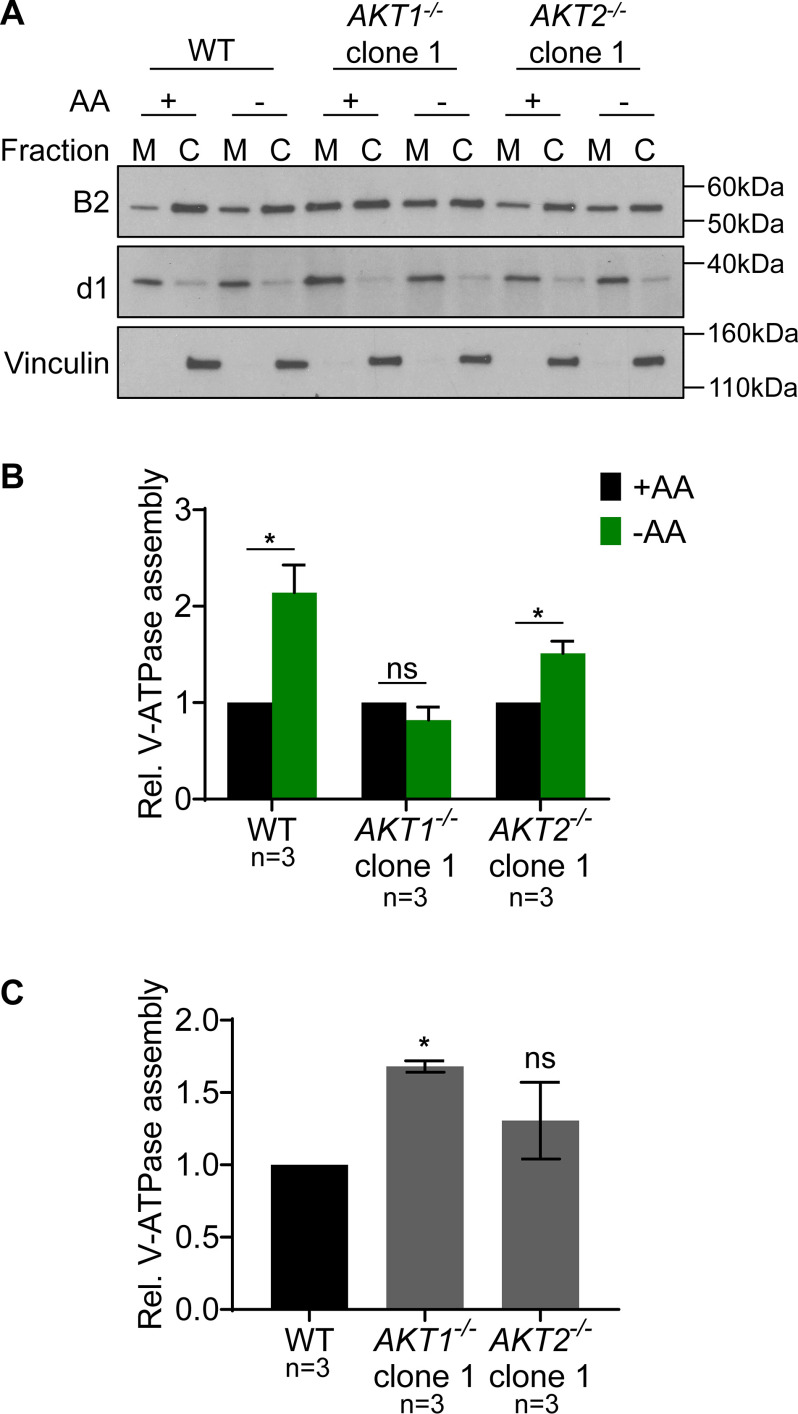
AKT1 knockout HEK293T cells fail to show increased V-ATPase assembly in response to amino acid starvation. A, WT HEK293T cells, an AKT1 knockout clone (AKT1−/−), and an AKT2 knockout clone (AKT2−/−) were maintained in amino acids or starved for 1 h, followed by cell fractionation, as described in Experimental procedures. Western blotting was performed on the membrane (M) and cytosolic (C) fractions using the indicated antibodies. B2 is a V1 subunit and, therefore, indicates the abundance of the V1 domain in each fraction. d1 is a V0 subunit and was used as a membrane loading control, while vinculin was used as a cytosolic loading control. The relative abundance of V1 in the membrane fraction versus the cytosolic fraction is a measure of V-ATPase assembly. Representative images are shown (n = 3). B, Quantification of Western blots described in panel A. The intensity of B2 in the membrane fraction was normalized to d1. The intensity of B2 in the cytosolic fraction was normalized to vinculin. The ratio of the normalized intensities gives the relative assembly. Values are expressed relative to the unstarved condition for each clone tested. WT and AKT2 knockout (AKT2−/−) cells displayed a statistically significant increase in V-ATPase assembly following amino acid starvation, whereas AKT1 knockout (AKT1−/−) cells did not. *, p < 0.05; ns, p ≥ 0.05. Error bars represent S.E. C, V-ATPase assembly for an unstarved AKT1 knockout clone (AKT1−/−) and an unstarved AKT2 knockout clone (AKT2−/−) is shown relative to unstarved WT cells. *, p < 0.05; ns, p ≥ 0.05. Error bars represent S.E.

