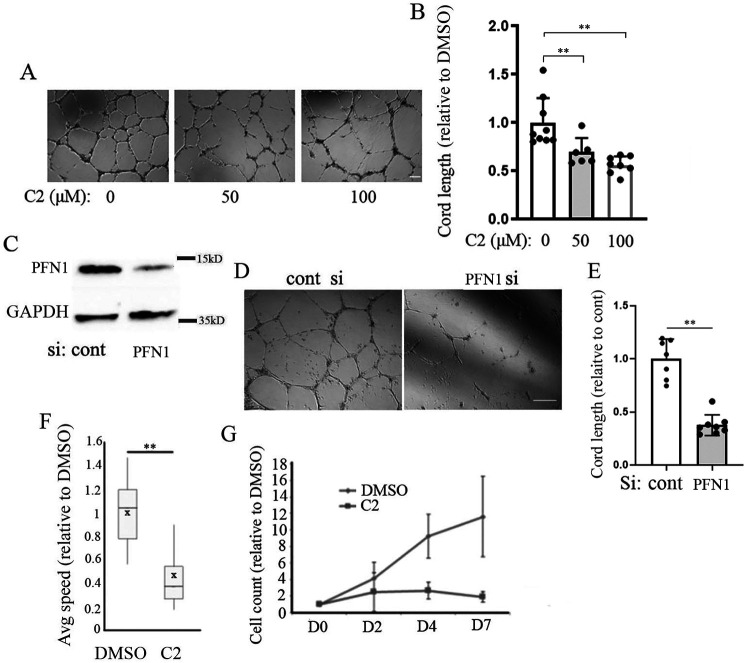
Figure 4.
Effect of small molecule inhibitor of PFN1–actin interaction on migration, proliferation, and angiogenic ability of human retinal VECs. A and B, representative images (A) and quantification (B) of Matrigel-induced cord formation of primary HmRECs after overnight treatment with either DMSO or 50 or 100 μm C2 (data summarized from three independent experiments; scale bar, 100 μm). C–E, representative images (D) and quantification (E) of cord formation of control versus PFN1-siRNA transfected primary HmRECs (data summarized from two independent experiments with three technical replicates; scale bar, 100 μm). Immunoblot in C confirms PFN1 knockdown with GAPDH blot serving as the loading control. F, box-and-whisker plot showing the relative migration speed of HmRECs in C2 (50 μm) versus DMSO-treated conditions (based on analyses of ∼50–60 cells/group from two independent experiments). G, line graph showing the effect of 50 μm C2 on proliferation of HmRECs over a period of 7-day treatment (data summarized from three experiments). In all panels, ** represents p < 0.01. cont, control; si, siRNA.

