Figure 4.
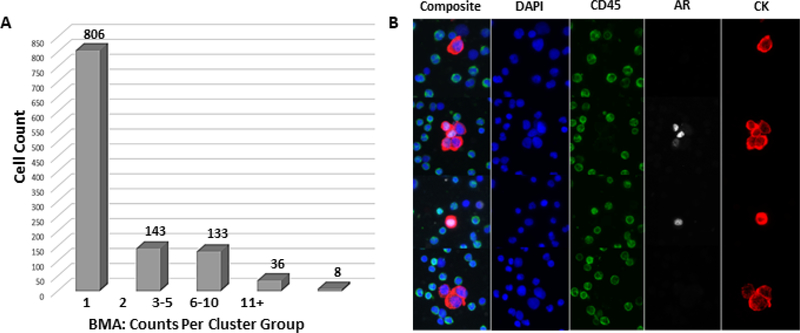
(a) MTC enumeration in BMA. Total counts are reflected by cluster group size. The y-axis reflects the number of cells within each cluster group and the x-axis reflects each cluster group category including single cells, cluster of 2 cells, cluster of 3–5 cells, cluster of 6–10 cells, and clusters of 11 and more cells. Overall, 3673 cells ml−1 were detected in BMA. (b) AR expression heterogeneity in MTCs. Each row shows both composite and individual DAPI, CK, CD45, and AR channel for each cell. DAPI is shown in blue, CK in red, AR in white, and CD45 in green. AR expression was located in the nucleus in both single cells and cell clusters despite differences in expression levels. Other single cells or cell clusters had no AR at all, showing heterogeneity in MTCs.

