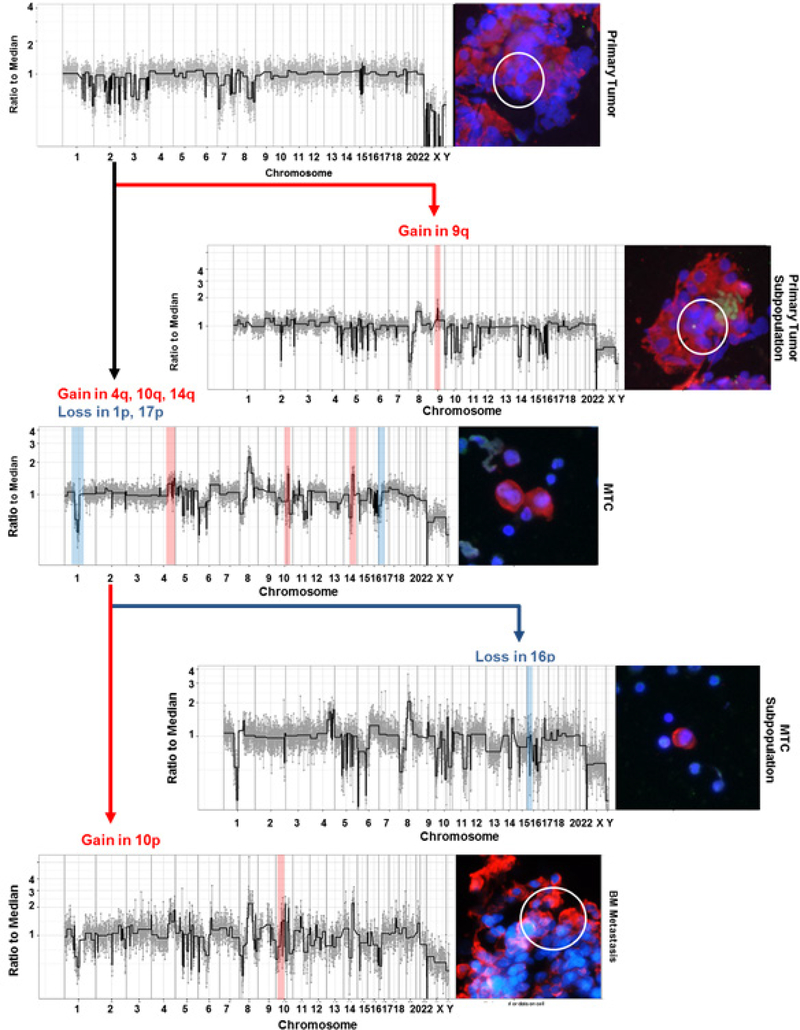
Figure 7.
Cell lineage of dominant clone starting from the primary tumor. Cells in the bone marrow gained additional alterations, such as losses in chromosomes 1 and 17 as well as amplifications in 4q, 10q, and 14q as they evolved from PT. A subpopulation within the MTC was distinguished by the addition of a loss in 16p, and BMTP cell exhibited a 10p gain. Deviations from the original dominant population are highlighted with amplifications in red and deletions in blue. Through this analysis, the lineage of the cancer cells can be tracked from PT to MTCs to BMT. DAPI is shown in blue, CK in red, AR in white, and CD45 in green.

