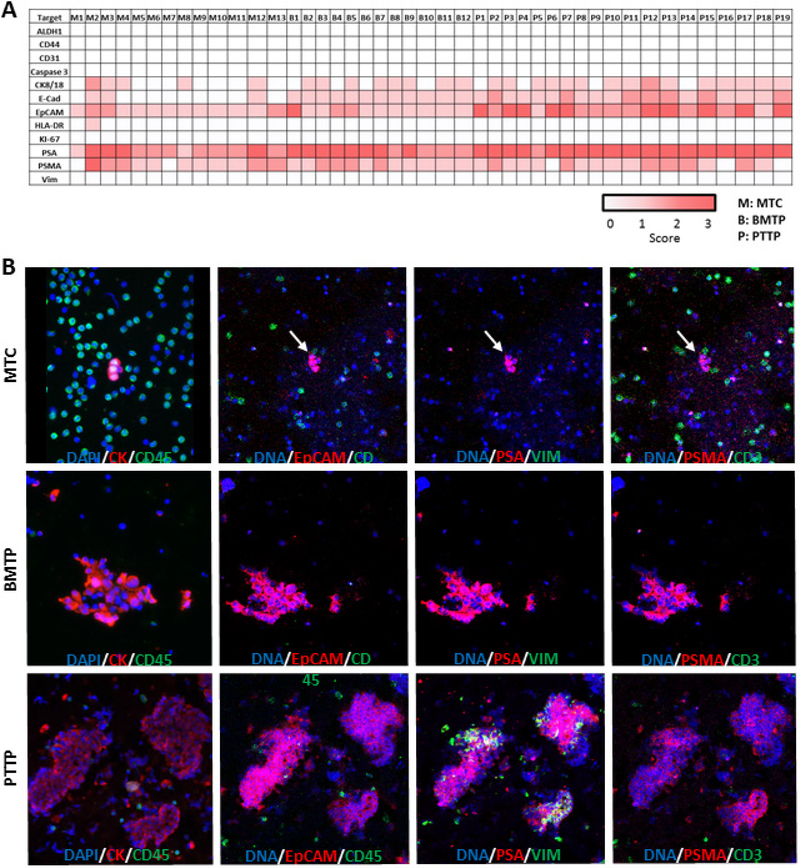
Figure 9.
(a) Four-level scoring heatmap for IMC analysis of single MTC and tissue imprints of BMTP and PTTP. Each protein is scored by ion count, and the LOD is determined by a signal-to-noise (S/N) ratio ⩾ 3 or a standard deviation of the mean (SDOM) above 3.3. For each marker, below the LOD is a 0, above the LOD is a 1, a S/N ratio between 7 and 20 or SDOM > 6 is a 2, and a S/N ratio above 20 or SDOM above 12 is a 3. (b) Composite images comparing fluorescent imaging to IMC analysis of all three sample types. The first panel on the left shows fluorescent images with DAPI in blue, CK in red, and CD45 in green. All subsequent panels are IMC-generated composite images showing DAPI in blue followed by two different markers in red and green. EpCAM confirmed epithelial character of most of the cells while PSA and PSMA verified the prostatic source of the samples. Vimentin (VIM) expression in regions of PTTP highlighted the stromal cells of the prostate.

