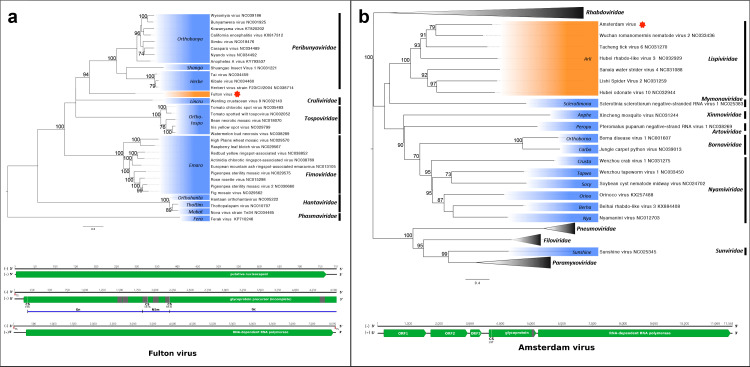
Fig. 2.
Phylogenetic analysis and genome organizations of Fulton virus (a) and Amsterdam virus (b). Maximum-likelihood trees were constructed using RdRp protein domain sequences for mononegaviruses and bunyaviruses (pfam00946 and pfam04196, respectively). The scale bar represents substitutions per site and bootstrap support values are displayed when greater than 70 %. Representative viral genera are highlighted in blue. Viruses identified in this study are marked by a red star and the proposed genera are highlighted in orange. Genome illustrations indicate putative open reading frames (green arrows). Genome length is not to scale; numbers indicate nucleotide position. Terminal sequences (TSs) for Fulton virus are indicated with red boxes. Glycoproteins are labelled with hydrophobic domains (grey shading) and predicted cleavage sites (CS) with corresponding amino acid position. The Fulton virus N-terminal glycoprotein (Gn), non-structural movement protein (NSm) and C-terminal glycoprotein (Gc) are demarcated in blue.

