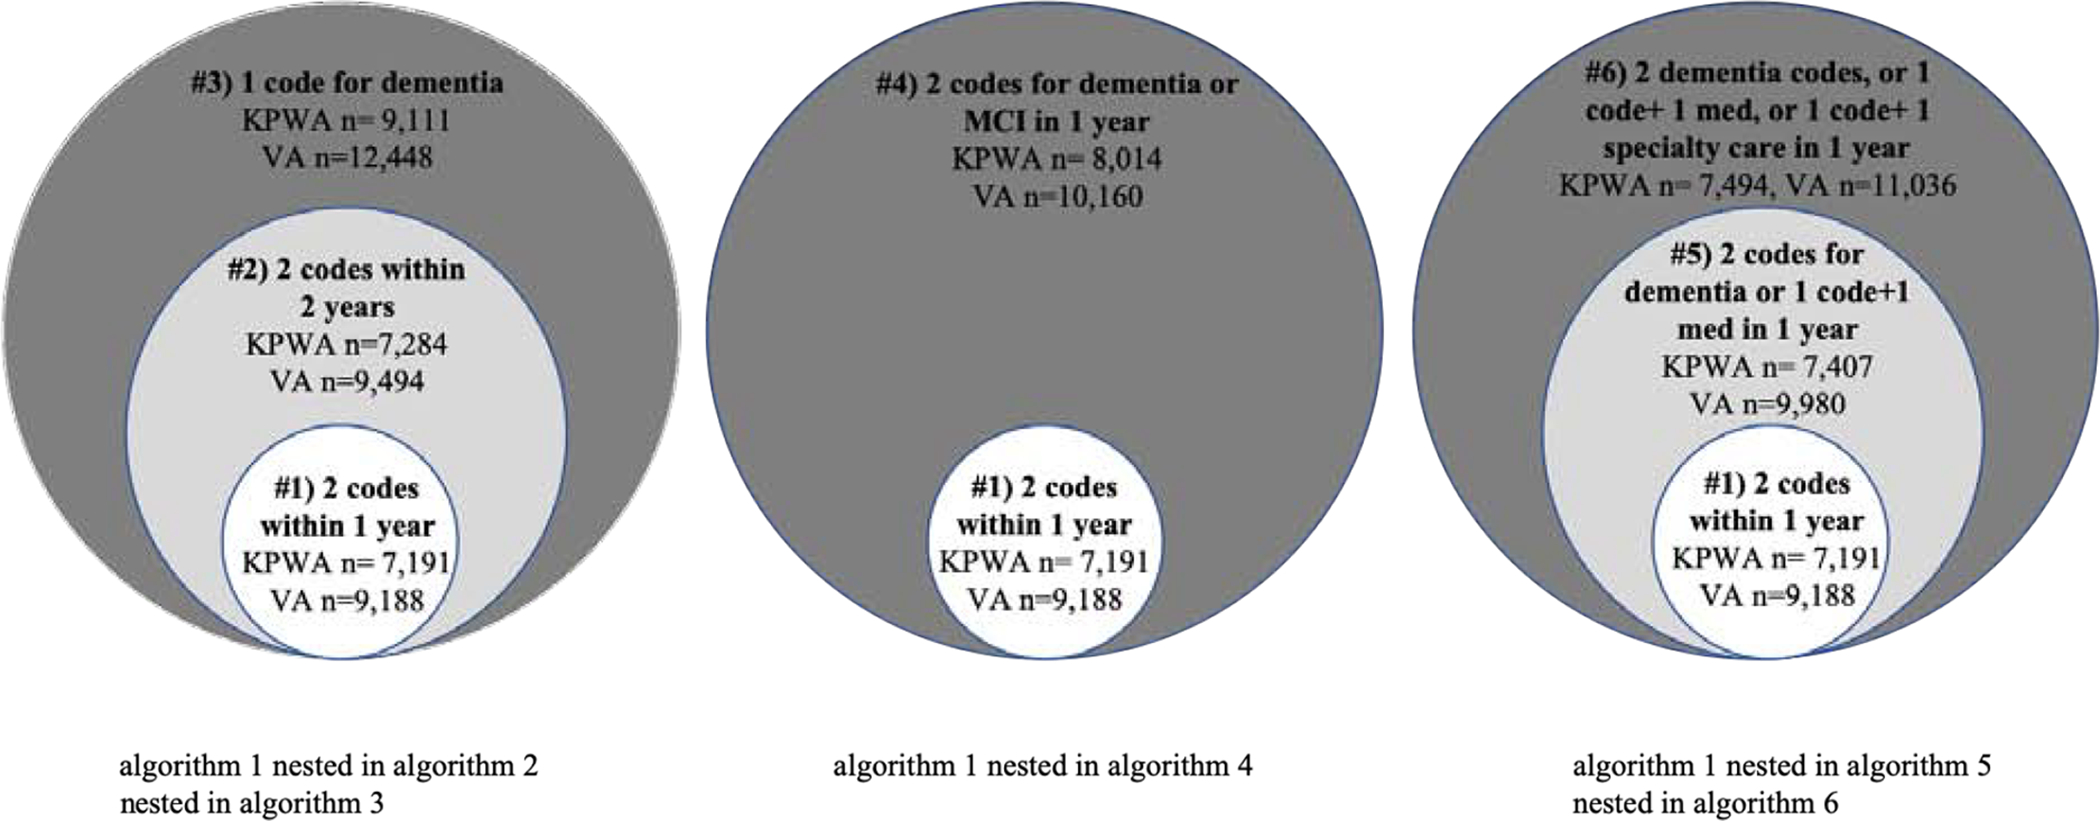
Figure 1:

Nested algorithms in study. This figure shows the three groups of nested, hierarchical algorithms. The necessary criteria for each algorithm are shown along with the number from each population (KPWA or VHA) who met each algorithm. The larger circles indicate the algorithms with less-stringent criteria. As you move toward the center, the algorithm criteria becomes more stringent either by requiring more data or a shorter amount of time.
