
Figure 5:
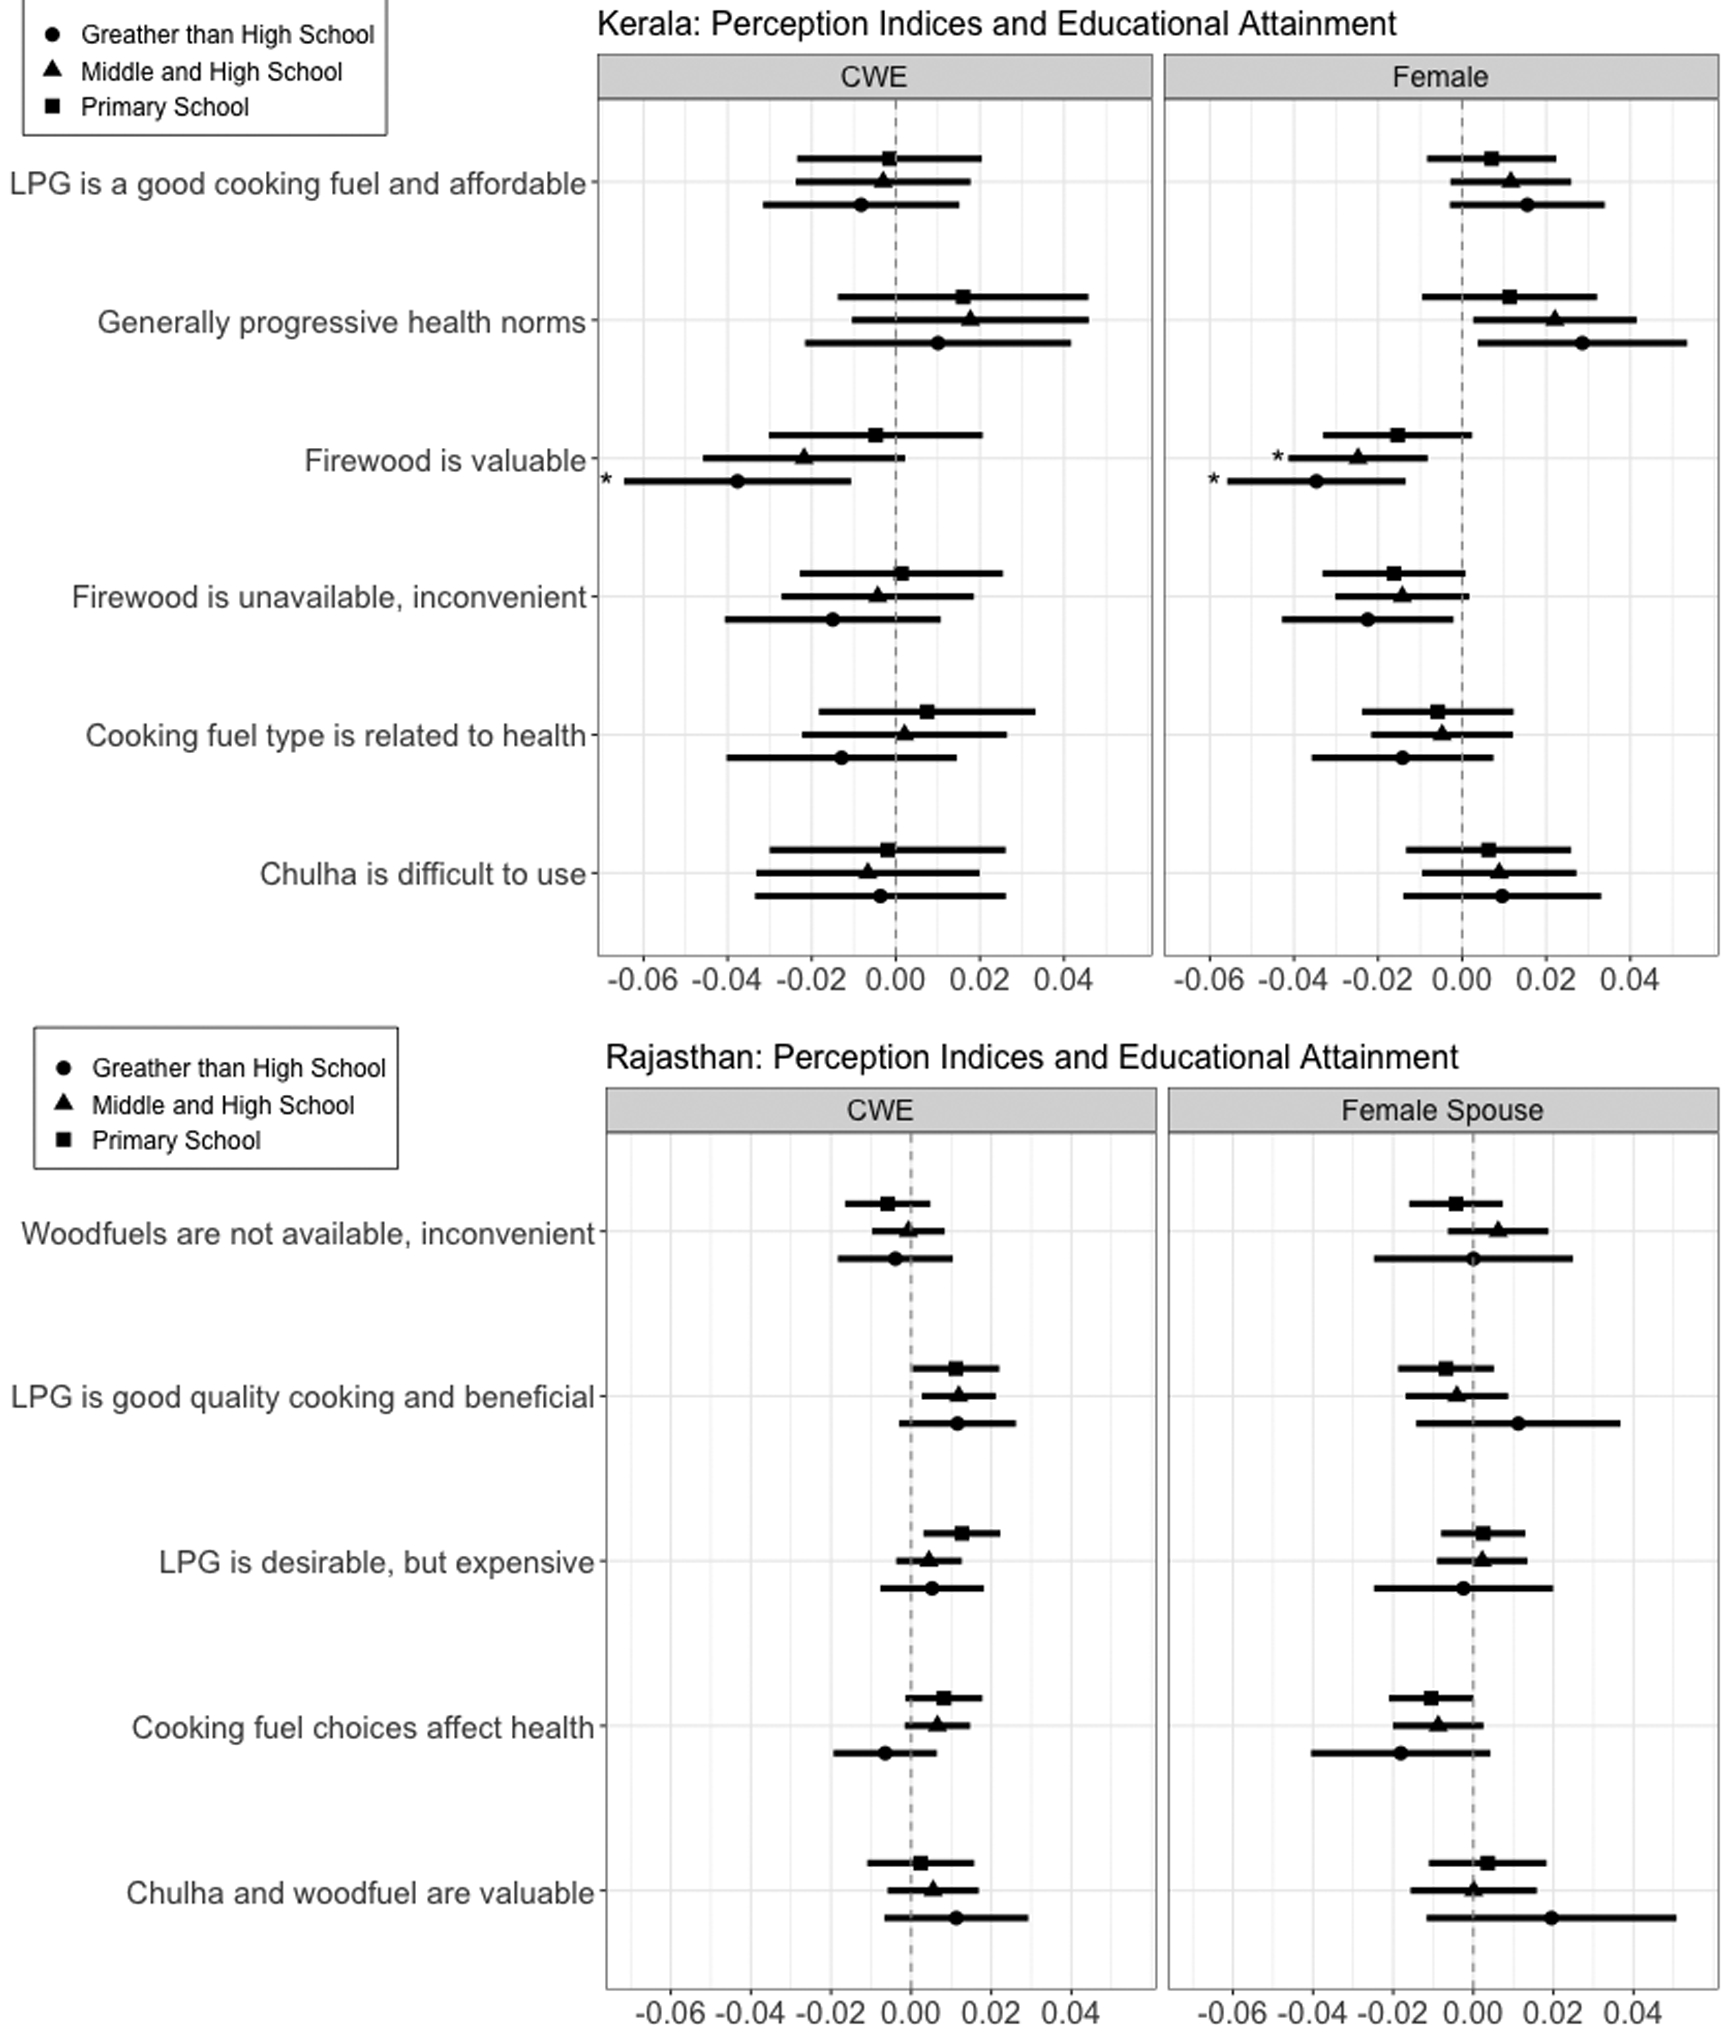
Coefficient plot for linear regressions showing the association between CWE education and perception indices in Kerala households. Baseline CWE education is illiterate / no formal education. Regressions control for all covariates (not shown). Coefficients are not exponentiated. Whiskers show 95% confidence intervals. Stars show statistical significance after Benjamini-Hochberg method for controlling for false discovery rate: * P<0.10, ** P<0.05, *** P<0.01.