
Figure 7:
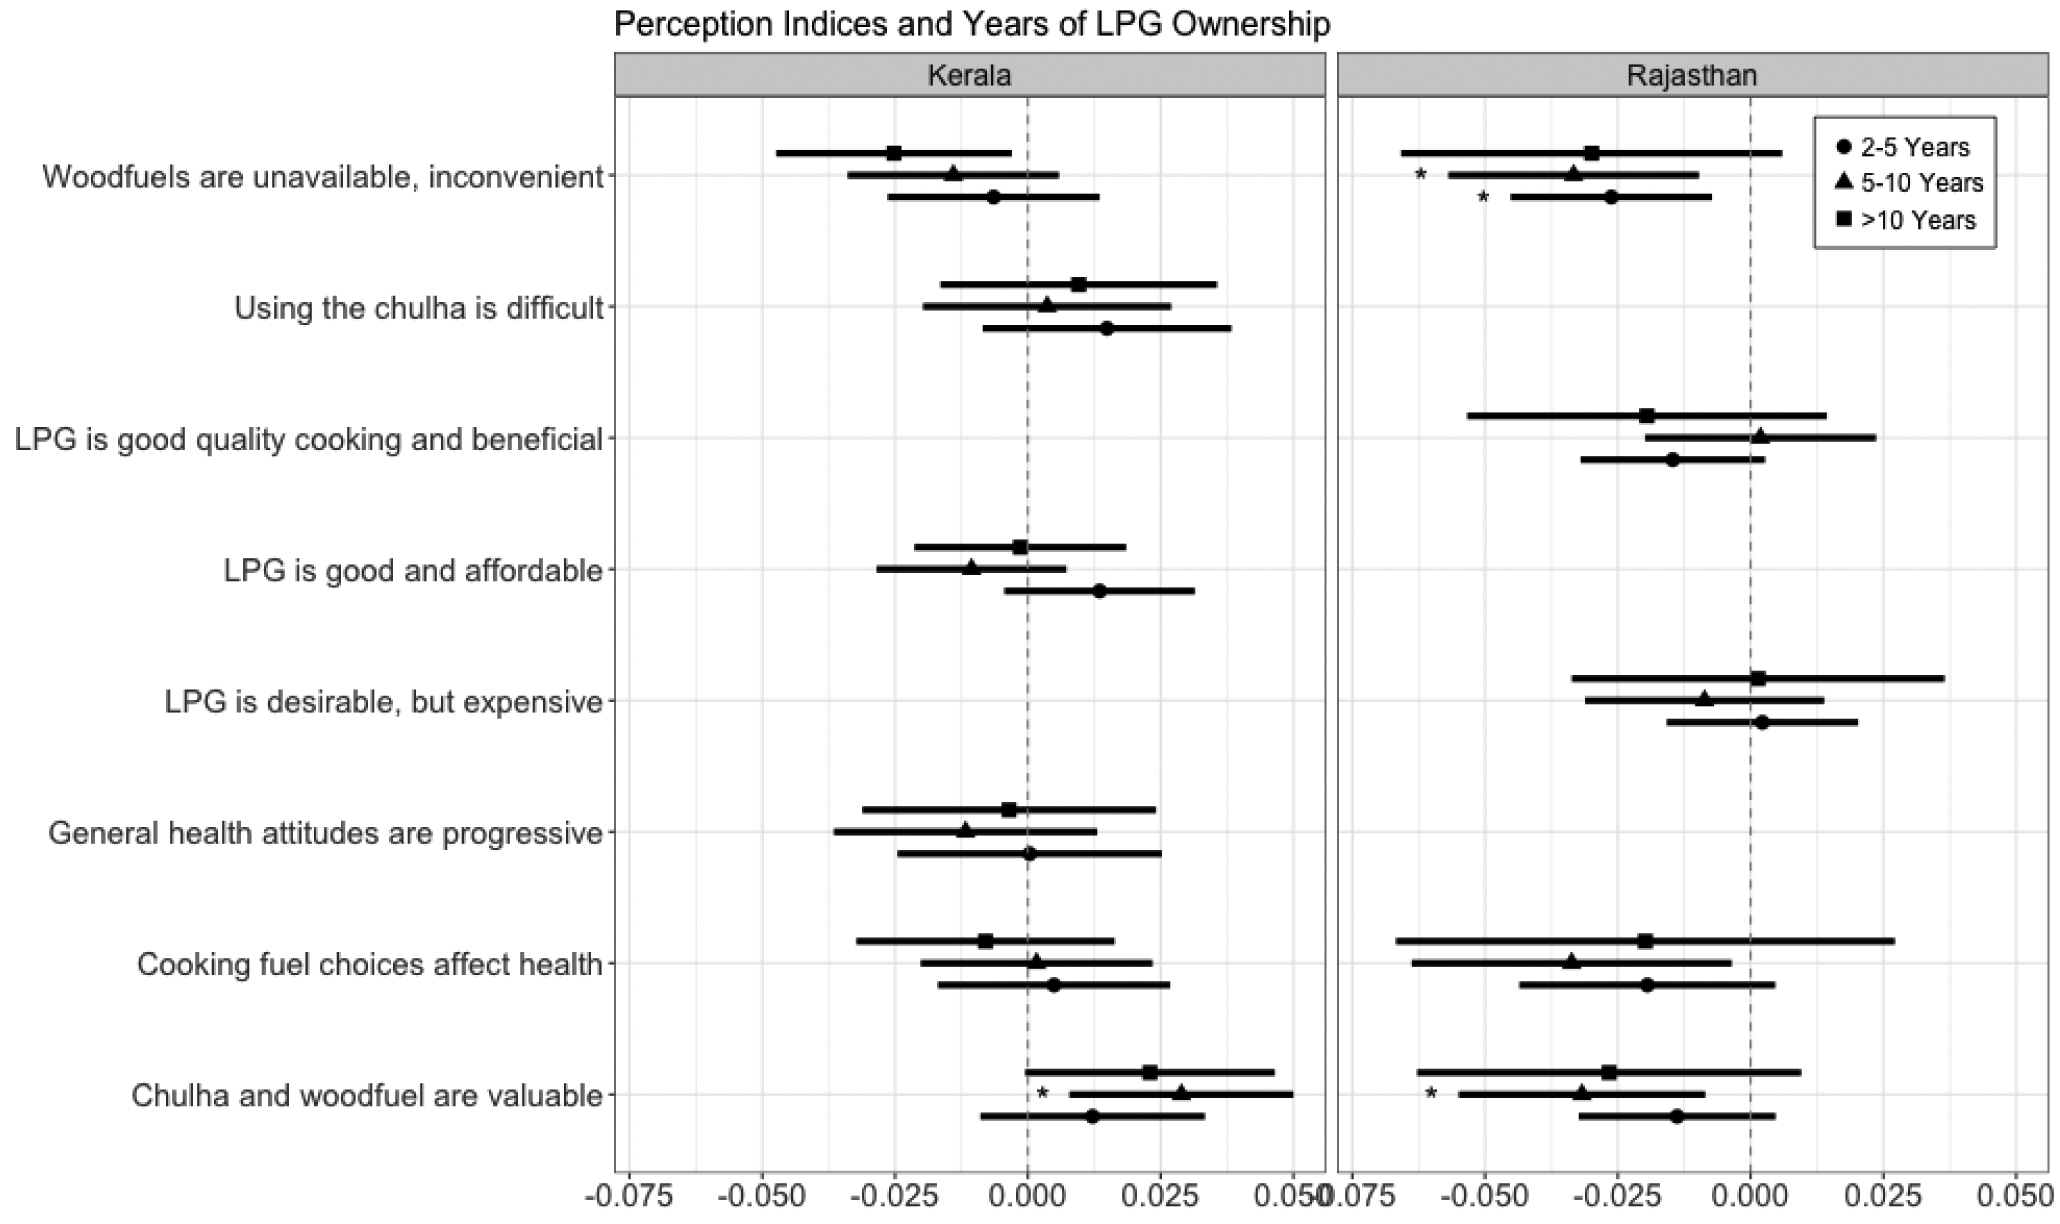
Coefficient plot for linear regressions showing the associations between perception indices and yeas of LPG ownership in Kerala and Rajasthan households. Baseline level is “1–2 Years.” Regressions also control for covariates and district fixed effects (not shown). Coefficients are not exponentiated. Whiskers show 95% confidence intervals. Stars show statistical significance after Benjamini-Hochberg method for controlling for false discovery rate: * P<0.10, ** P<0.05, *** P<0.01.