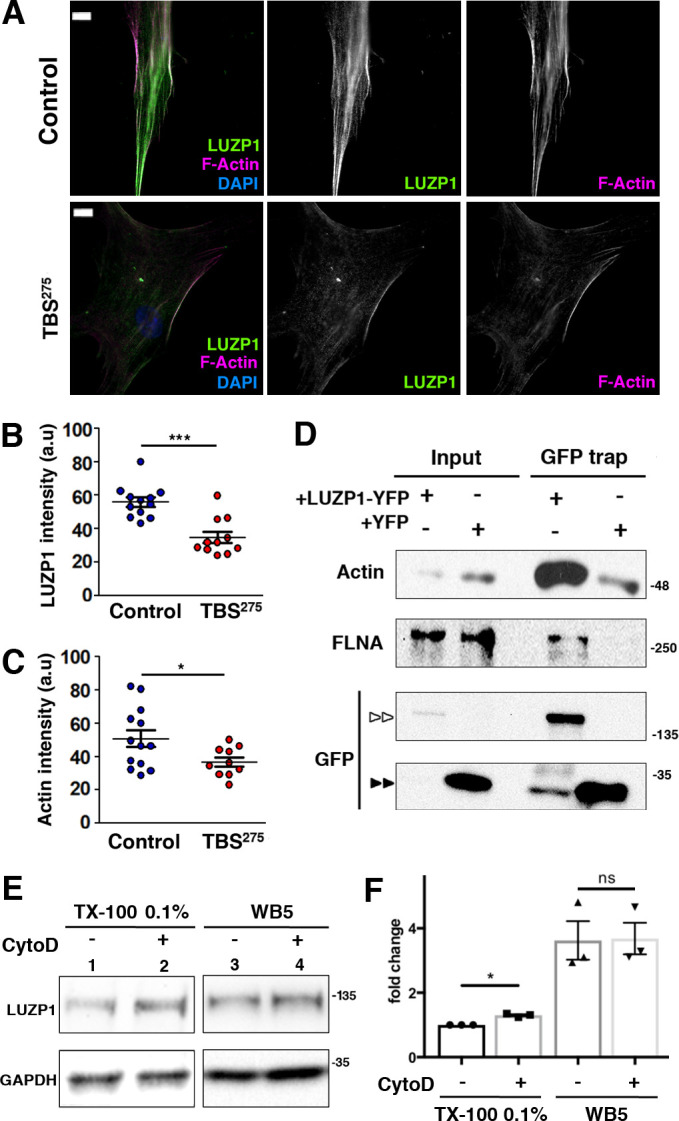
Figure 4. Reduction in LUZP1 coincides with decreased F-actin.
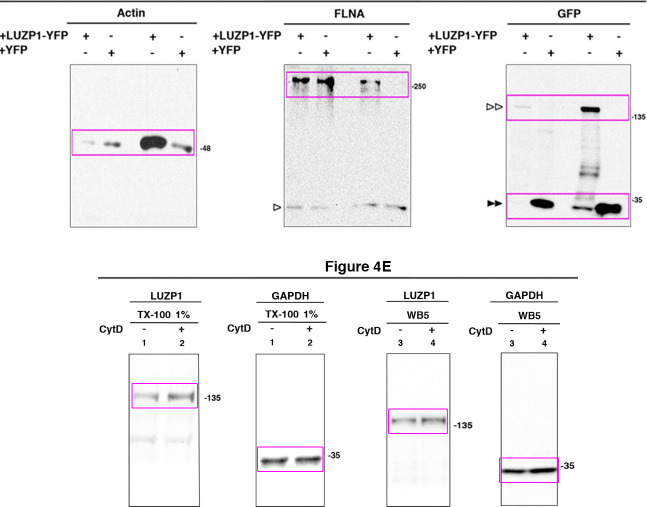
(A) Immunofluorescence micrographs of Control and TBS275 human fibroblasts stained with an antibody against endogenous LUZP1 (green), phalloidin to label F-actin (magenta), and counterstained with DAPI to label the nuclei (blue). Black and white images show the single green and magenta channels. Note the overall reduction in LUZP1 and F-actin levels in TBS275 compared to control fibroblasts. Scale bar, 10 µm. Imaging was performed using widefield fluorescence microscopy (Zeiss Axioimager D1, 63x objective). (B, C) Graphical representation of the LUZP1 (B) and F-actin (C) mean intensities, corresponding to the experiments shown in (A); n ≥ 6 micrographs. Three independent experiments were pooled together. P-values were calculated using the unpaired two-tailed Student´s test or U- Mann-Whitney test. (D) Western blot of inputs or GFP-Trap pulldowns performed in HEK 293FT cells transfected with LUZP1-YFP or YFP alone. Anti-GFP antibody detected YFP alone (two black arrowheads) and LUZP1-YFP (two white arrowheads). Blots shown here are representative of three independent experiments. Molecular weight markers are shown to the right. Specific antibodies (LUZP1, GAPDH, CCP110, CEP97, GFP) were used as indicated. (E) Western blot of total cell lysates of HEK 293FT treated or not with cytochalasin D (CytoD) in a mild lysis buffer (TX-100 0.1%, lanes 1, 2) or a strong lysis buffer (WB5, lanes 3, 4). Note the increase in LUZP1 levels upon actin polymerization blockage with CytoD, exclusively when cells were lysed on 01% TX-100-based lysis buffer. GAPDH was used as loading control. In (D) and (E) panels, specific antibodies (LUZP1, GAPDH, actin, FLNA, GFP) were used as indicated. (F) Graphical representation of LUZP1 vs GAPDH band intensities in (E) normalized to lane 1. Graphs represent Mean and SEM of three independent experiments. P-value was calculated using two tailed unpaired Student´s t-test. Molecular weight markers in (D) and (E) are shown to the right.


