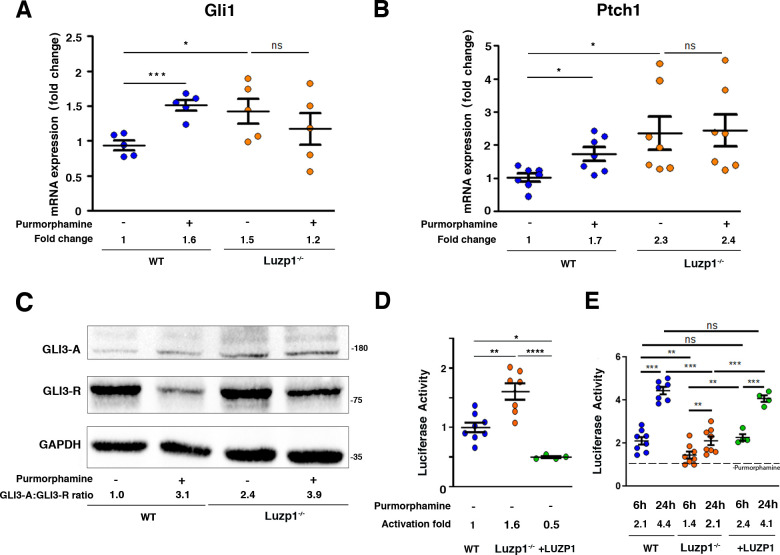
Figure 7. Luzp1-/-cells show aberrant Shh signaling.
(A, B) Graphical representation of the fold-change in the expression of Gli1 (n = 5) (A) and Ptch1 (n = 7) (B) obtained by qRT-PCR from wild-type Shh-LIGHT2 cells (WT; blue dots) or Shh-LIGHT2 cells lacking Luzp1 (Luzp1-/-; orange dots), treated (+) or not (-) with purmorphamine for 24 hr. (C) Western blot analysis of lysates from WT and Luzp1-/- cells. Samples were probed against GLI3 using an antibody that detects both GLI3-activator form (GLI3-A) and GLI3-repressor form (GLI3-R); GAPDH was used as loading control. Numbers under the lanes are the Mean of 3 independent experiments, resulting of dividing the activator by the repressor intensities, taking WT non-induced value as 1. Molecular weight markers are shown to the right. (D, E) Graphical representation of fold-change in luciferase activation when WT (n > 7; blue dots), Luzp1-/- (n > 7; orange dots) or +LUZP1 (n = 4; green dots) cells are treated for 6 and 24 hr or not (-) with purmorphamine. (E) Each treated condition was normalized against its respective non treated condition, taking the non-induced value as 1 (dashed line). All graphs represent the Mean and SEM. P-values were calculated using two-tailed unpaired Student´s t-test or One-way ANOVA and Bonferroni post-hoc test.
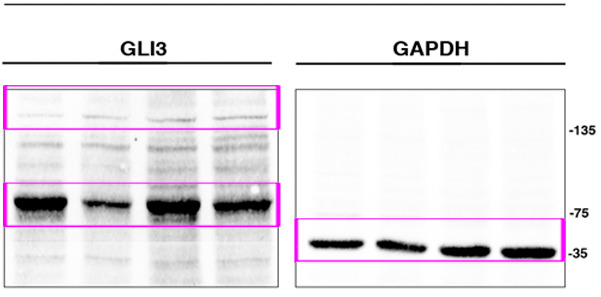
Figure 7—figure supplement 1. Full western blot images for Figure 7.


