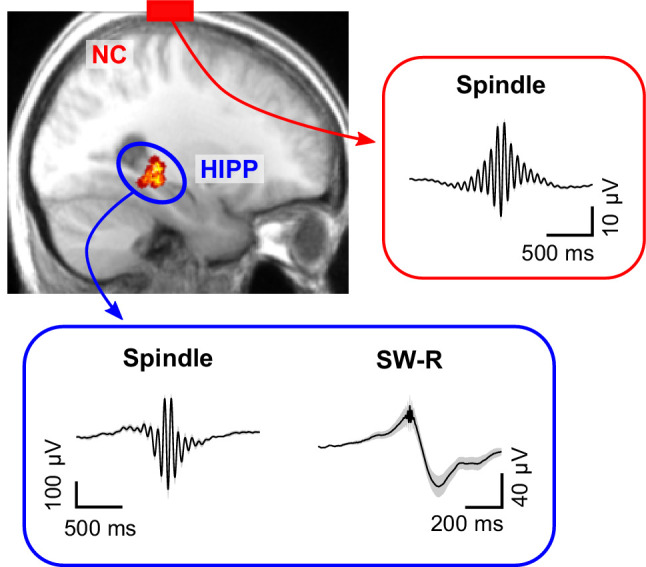
Figure 1. Cortical sleep spindles and hippocampal spindles and SW-Rs.

Top left: heat map illustrating the position of individual contacts across all patients within the hippocampus overlaid on a sagittal slice of the mean structural MRI. Right and bottom insets show the grand average (± SEM) spindle and sharp-wave ripple waveforms across all patients in neocortex (red, NC) and hippocampus (blue, HIPP).
