
Author response image 1. Crosscorrelation between medial and lateral VTA dopamine neuron activity and freezing behavior.
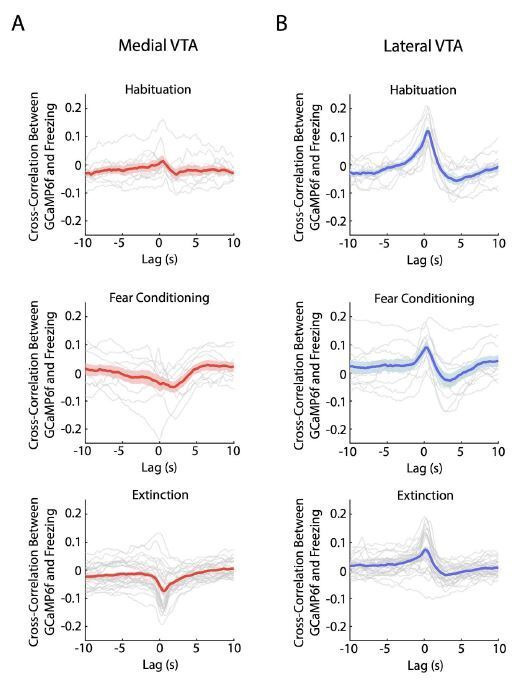
(A) Crosscorrelation between medial VTA dopamine neuron activity and freezing behavior during different experiment conditions: habituation (top plot), fear conditioning (middle plot), and fear extinction (bottom plot). For each plot, red line is the mean cross-correlation across mice, pink shading denotes SEM. Grey lines denote cross-correlation of an individual mouse for each experiment condition (n = 10 mice for habituation and fear conditioning sessions, n = 10 mice with 3 extinction days per mouse for fear extinction session). (B) Same as A, but for Lateral VTA, using blue instead of red line and shading to represent mean crosscorrelation across mice (n = 11 mice).