
Fig. 1. Potential models of student capital distributions.
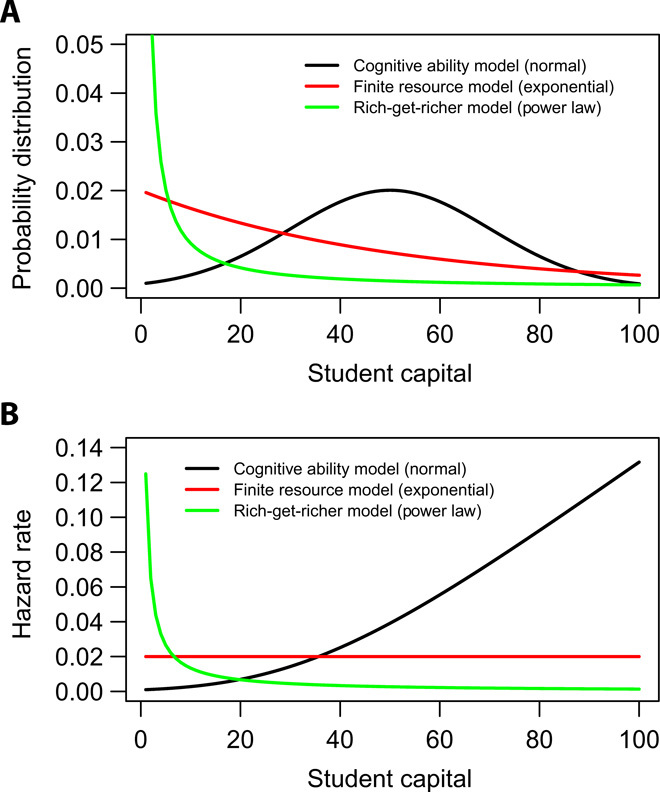
(A) Probability distribution function for each model. (B) Hazard rate of dropping out specified by each model. Specifically, the vertical axis gives the probability that a student who has k units of student capital will stop their education before earning k + 1 units. In both cases, the trends suggested are qualitative, designed to show the shape of the distribution rather than any specific numbers.