
Figure 10.
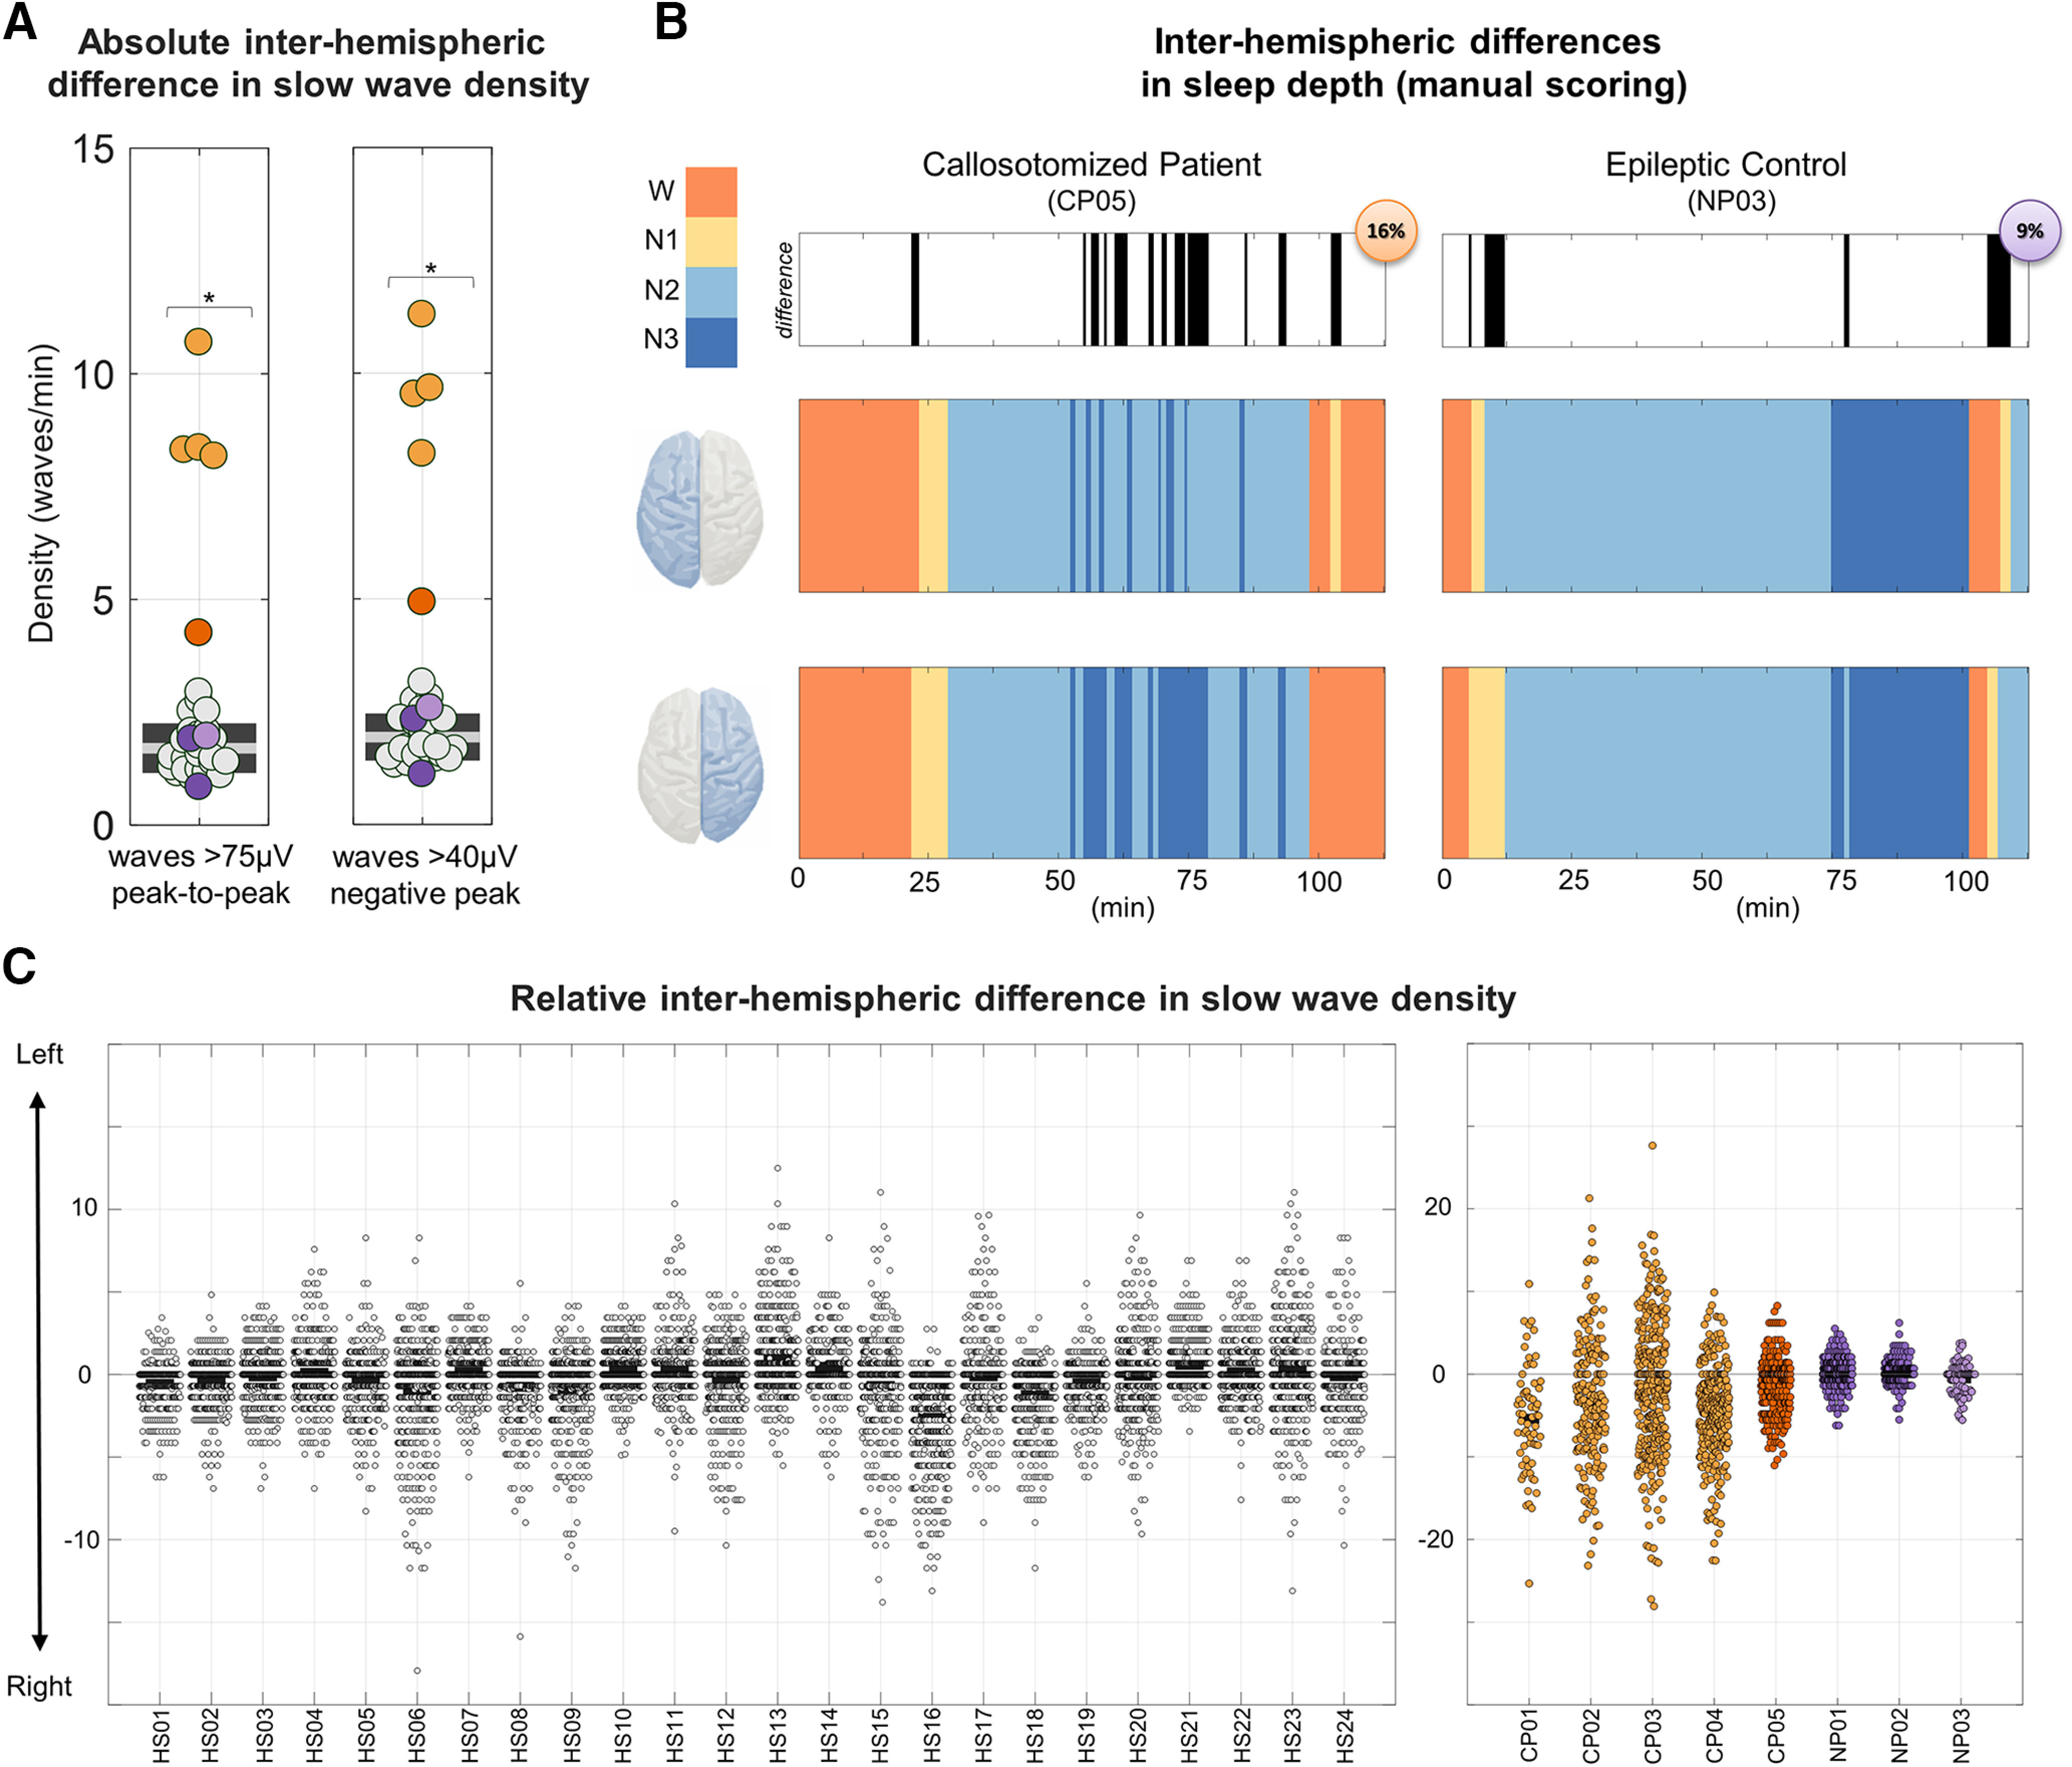
Inter-hemispheric difference in slow-wave density. A, Absolute inter-hemispheric difference in slow-wave density. The plot on the left shows the absolute inter-hemispheric (|left-right|) difference in slow-wave density. CPs are represented with orange dots (CP05 = dark orange), NPs with purple dots (NP03 = light purple), and HSs with light gray dots. *pcorrected < 0.05. B, Sleep scoring (120 min; 0 = time of lights off) in a callosotomized patient (CP05) and in the noncallosotomized patient with epilepsy (NP03). Sleep scoring was performed separately for each hemisphere (i.e., using only electrodes of the left or right side) by an operator blind to both the identity of the subjects and the evaluated brain hemisphere. In the top panel, black sections indicate epochs for which different stages were scored across the two hemispheres. Bottom panels represent the sleep scoring for the first sleep cycle in the two patients and for each hemisphere (left top, right bottom). C, Difference in the mean slow-wave density (in waves per minute) across three left (F3, C3, P3) and three right (F4, C4, P4) channels. A peak-to-peak amplitude threshold corresponding to 75 µV was applied to minimize spurious cross-hemispheric detection caused by simple volume conduction. Each dot represents a different NREM sleep epoch. The left plot represents each of the HSs (HS01–HS24), while the right plot shows the CPs (CP01–CP05) and the NPs (NP01–NP03). Lower (negative) values indicate a higher number of slow waves detected in the right hemisphere. In both the CP and HS groups there was a tendency toward a higher slow-wave density in the right relative to the left hemisphere.