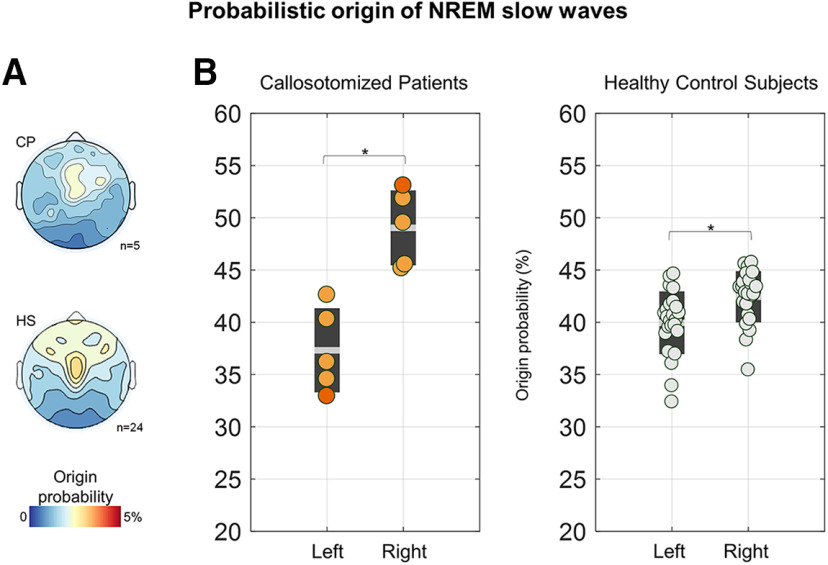
Figure 11.
Differences in probabilistic origin across the left and right hemispheres. A, Topographic map of probabilistic slow-wave origin in CPs (top) and HSs (bottom). Similar distributions, with maxima in central–lateral and anterior areas were found in both CPs and HSs. B, A higher proportion of slow waves originated in the right versus left hemisphere in both CPs and HSs. CPs are represented with orange dots (CP05 = dark orange), NPs with purple dots (NP03 = light purple), and HSs with light gray dots. *pcorrected < 0.05.

