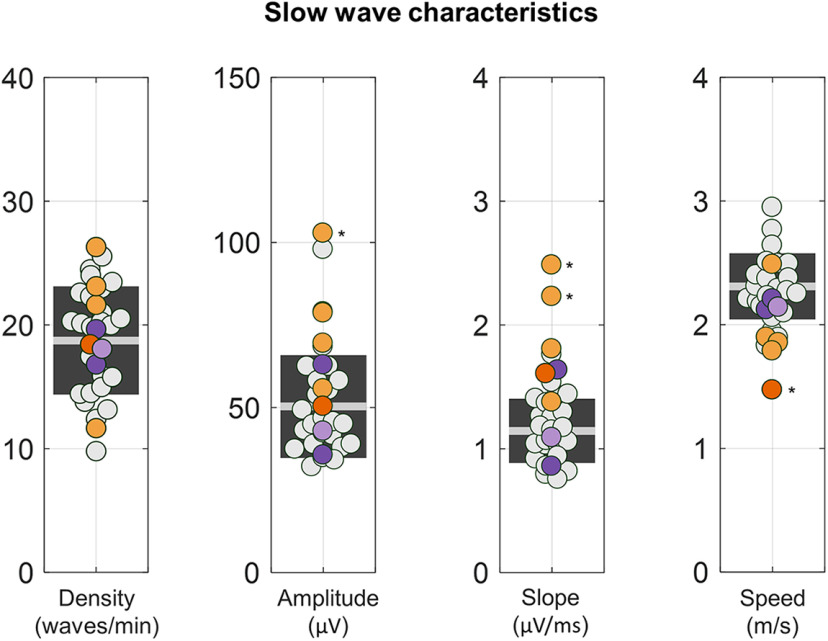
Figure 4.
Properties of NREM slow waves. For each subject, we computed slow-wave density (in number of waves per minute), negative amplitude (in microvolts), descending slope (in microvolts per milliseconds), and propagation speed (in meters per second). CPs are represented with orange dots (CP05 = dark orange), NPs with purple dots (NP03 = light purple), and HSs with light gray dots. The light gray horizontal line represents the mean for the HSs, while the dark gray box represents 1 SD around the mean. Values observed in the eight patients (CPs and NPs) were compared with the 24 HSs. *pcorrected < 0.05.

