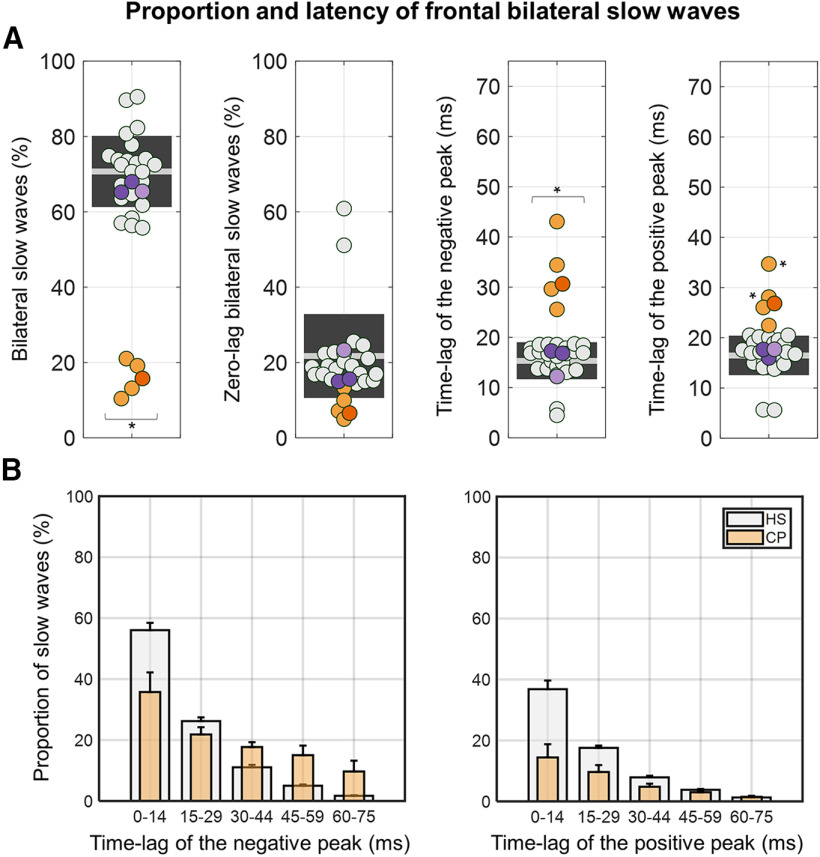
Figure 9.
Slow-wave synchronization across symmetrical frontal electrodes. A, The four plots respectively show (from left to right) the percentage of bilaterally detected slow waves, the proportion of perfectly synchronous (zero-lag) slow waves that may reflect volume conduction, the absolute time-lag between the negative peaks of bilateral slow waves, and the absolute time-lag between the positive peaks of bilateral slow waves. B, Distribution of time-lags for negative (left) and positive (right) peaks in HSs and CPs. Note that the percentages were calculated with respect to the total number of bilateral negative peaks and that bilateral positive peaks were not found in the explored time window for some of these slow waves. *pcorrected < 0.05.

