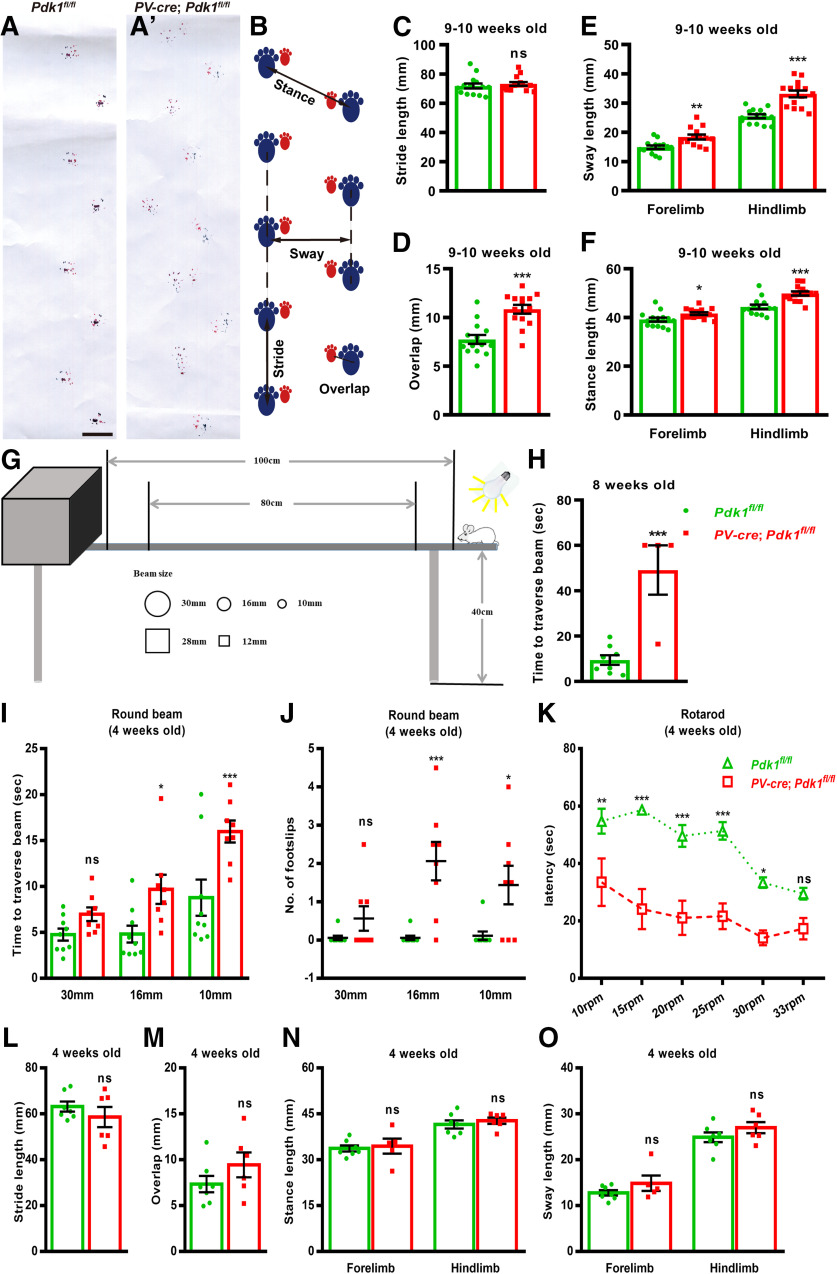
Figure 6.
Motor Defects in cKO-PV mice. A, A′, Gait of 9- to 10-week-old mice tested with a footprint assay was shown in red (forepaws; A) and blue (hindpaws; A′). B, Diagram of parameters measured in footprint analysis. C, The cKO-PV mice show a similar stride length to that of the Ctrl mice. D, The overlap length. E–F, Longer sway lengths (E) and stance lengths (F) of forelimbs and hindlimbs in the cKO-PV mice. G, Schematic illustration of the elevated beam-walk assay for testing motor coordination. H, The latency to cross a 28-mm-wide square beam at 8 weeks after birth. The Ctrl mice at 9.46 ± 2.14 s (n = 8 mice) versus the cKO-PV mice at 49.13 ± 10.87 s (n = 4 mice), p = 0.0005. I, The average time 4-week-old mice took to traverse the round beams. J, The average number of missteps for hindlimbs of 4-week-old mice to traverse the round beams. K, The latency to fall down from the rotarods in the cKO-PV mice (n = 8) was significantly reduced compared with that in the Ctrl mice (n = 9) at 4 weeks after birth. A two-way ANOVA; Bonferroni's post hoc analysis was used: p = 0.0055 for 10 rpm test; p < 0.0001 for 15 rpm test; p < 0.0001 for 20 rpm test; p < 0.0001 for 25 rpm test; p = 0.0154 for 30 rpm test; and p = 0.3137 for 33 rpm test. L–O, Gait of 4-week-old mice tested by footprint assay. Bar graphs show that there were no differences in the lengths of stride (L), overlap (M), stance (N), and sway (O) between the Ctrl and cKO-PV mice at 4 weeks. The data are the mean ± SEM. Data in C–F, H, and L–O were analyzed using a two-tailed Student's t test and a two-way ANOVA; Bonferroni's post hoc analysis was used in I–K. ***p < 0.001; **p < 0.01; *p < 0.05; ns, p ≥ 0.05. Scale bar, 20 mm.

