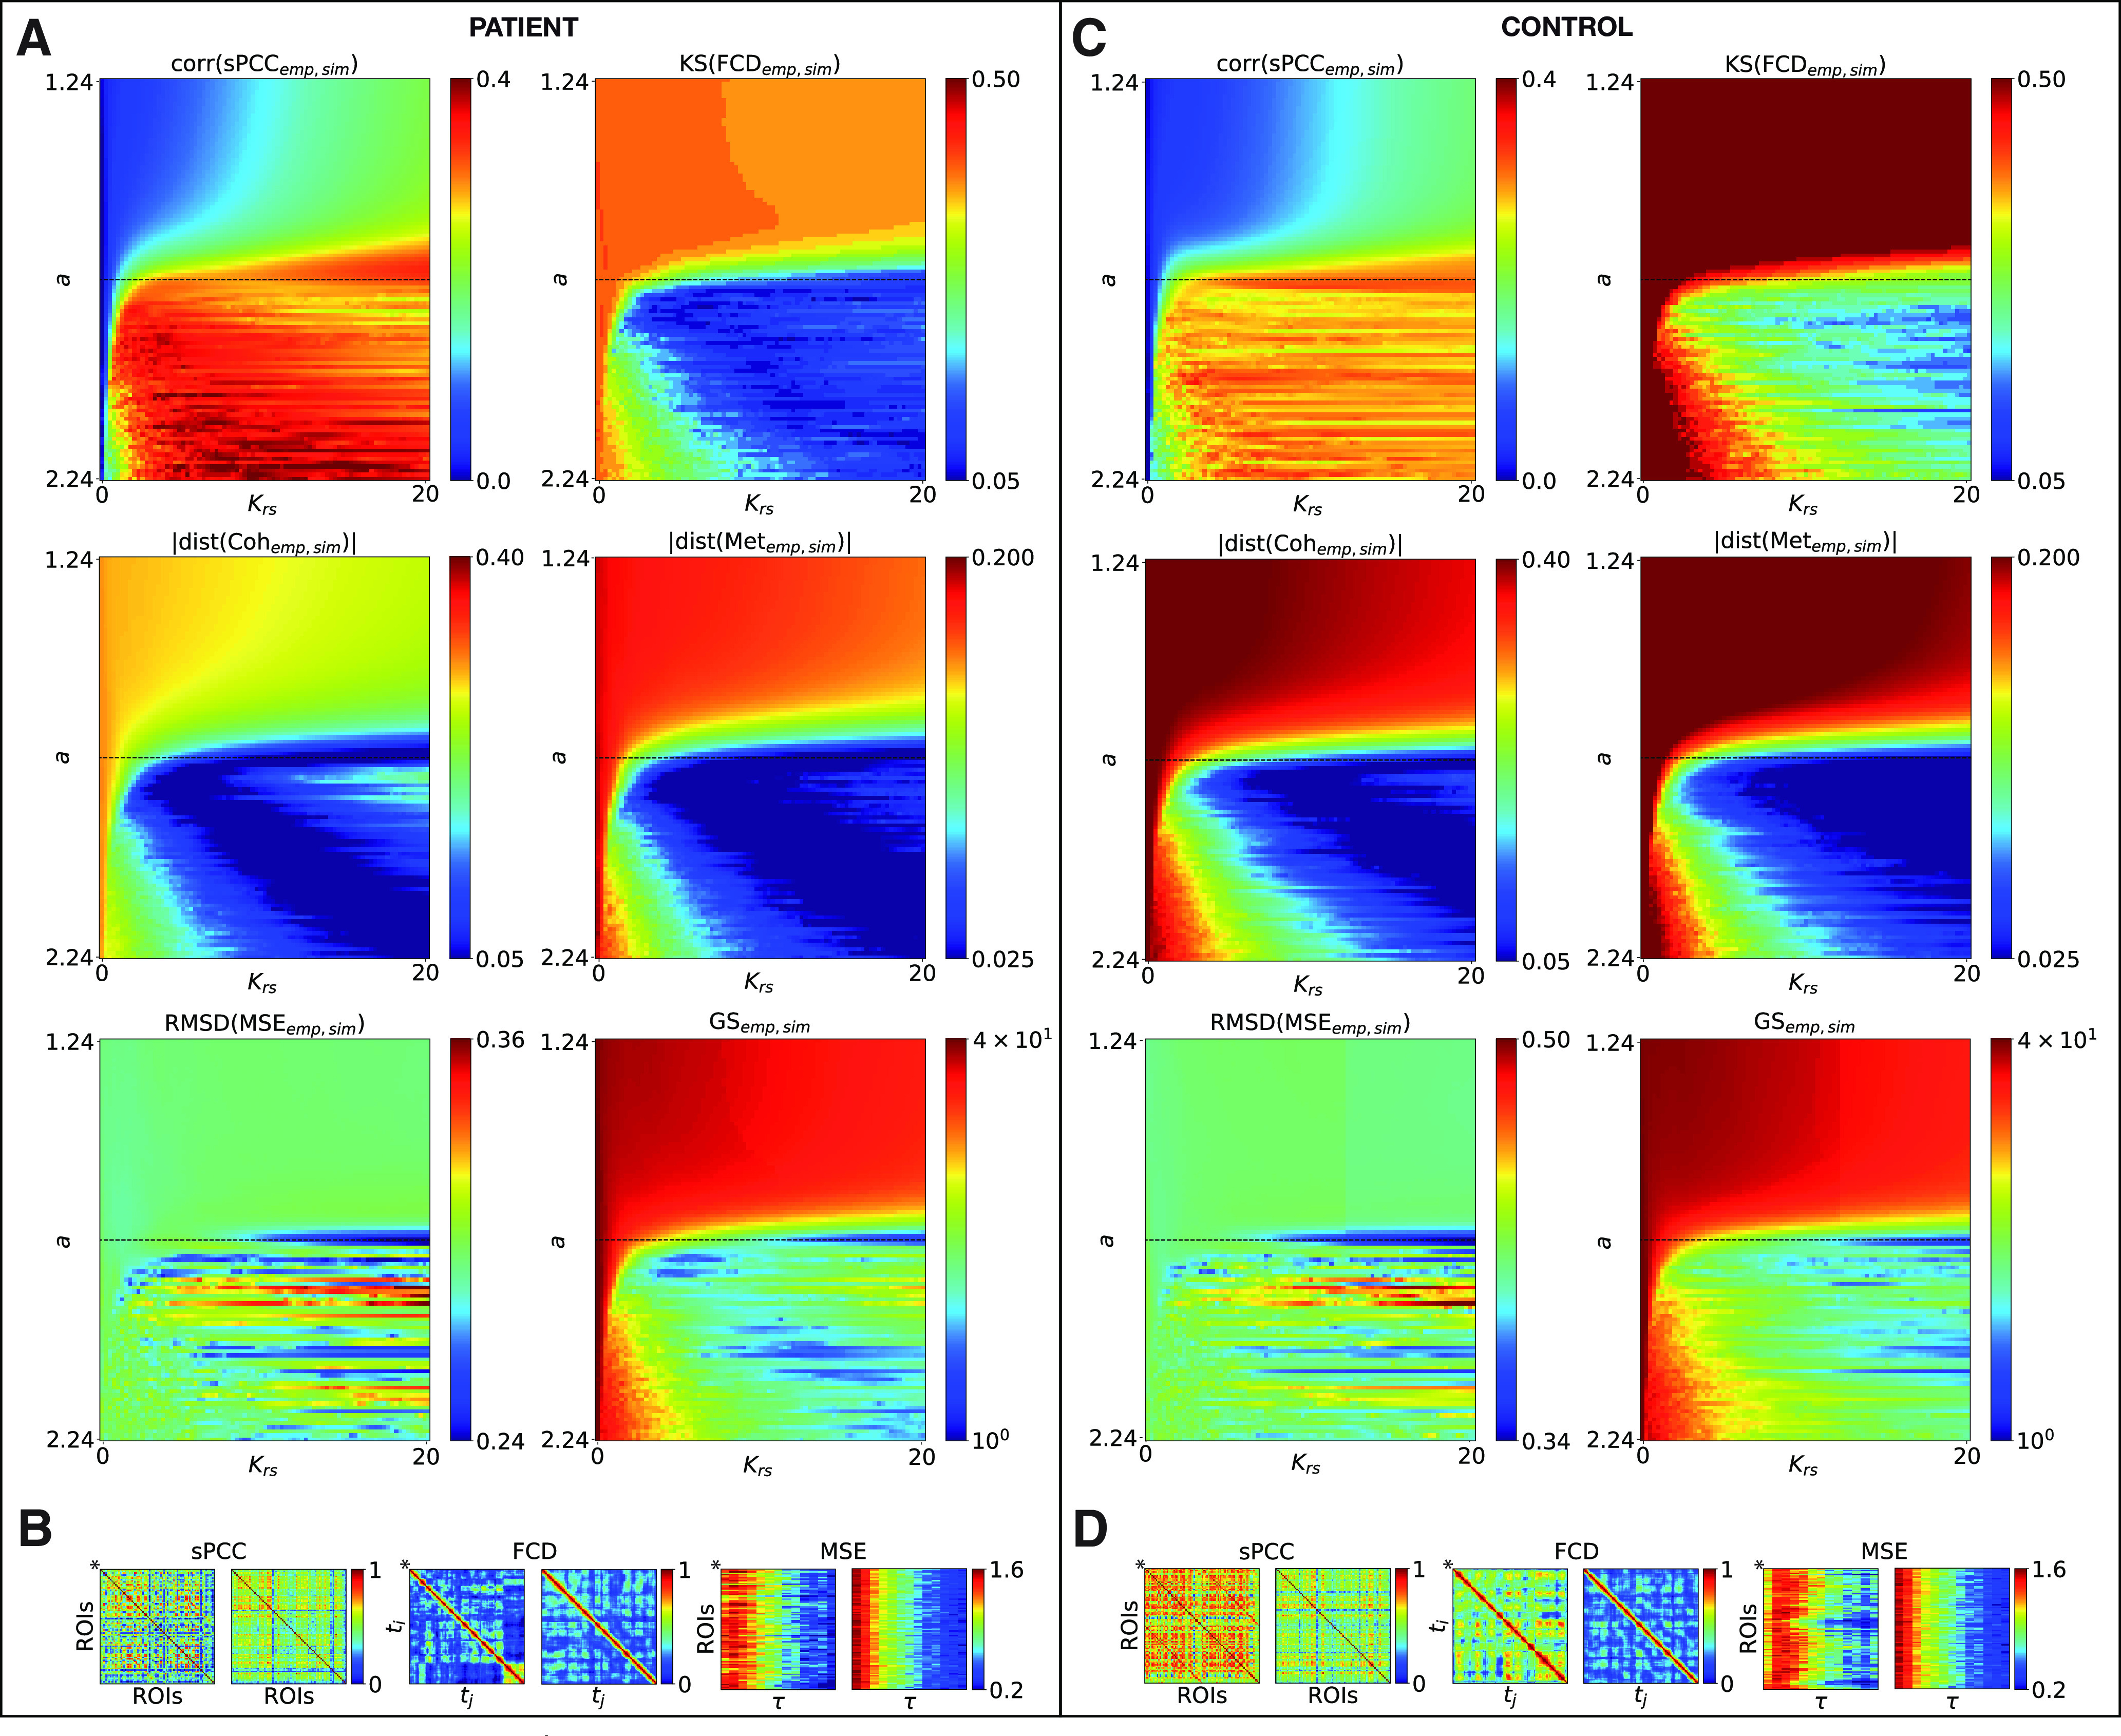
Figure 4.

Whole-brain parameter space explorations and RS-FC fitting for an exemplary epileptic patient and healthy control subject. A–C, The six metrics for assessing the RS-FC fitting between the simulated and empirical data are shown color coded as a function of the global coupling Krs (x-axis) and the bifurcation parameter a (y-axis). Top row, Correlation coefficient between the empirical and simulated sPCC matrices (left) and the K–S distance between the empirical and simulated FCD histograms (right). Middle row, Absolute value of the difference between the empirical and simulated coherence (left) and metastability (right). Bottom row, RMSD between the empirical and simulated MSE matrices (left) and GS metric (right). The horizontal black dashed lines represent the critical point. B–D, Simulated sPCC, FCD, and MSE matrices for the optimal working point. For comparison, the same matrices are plotted for the empirical data (denoted by*).
