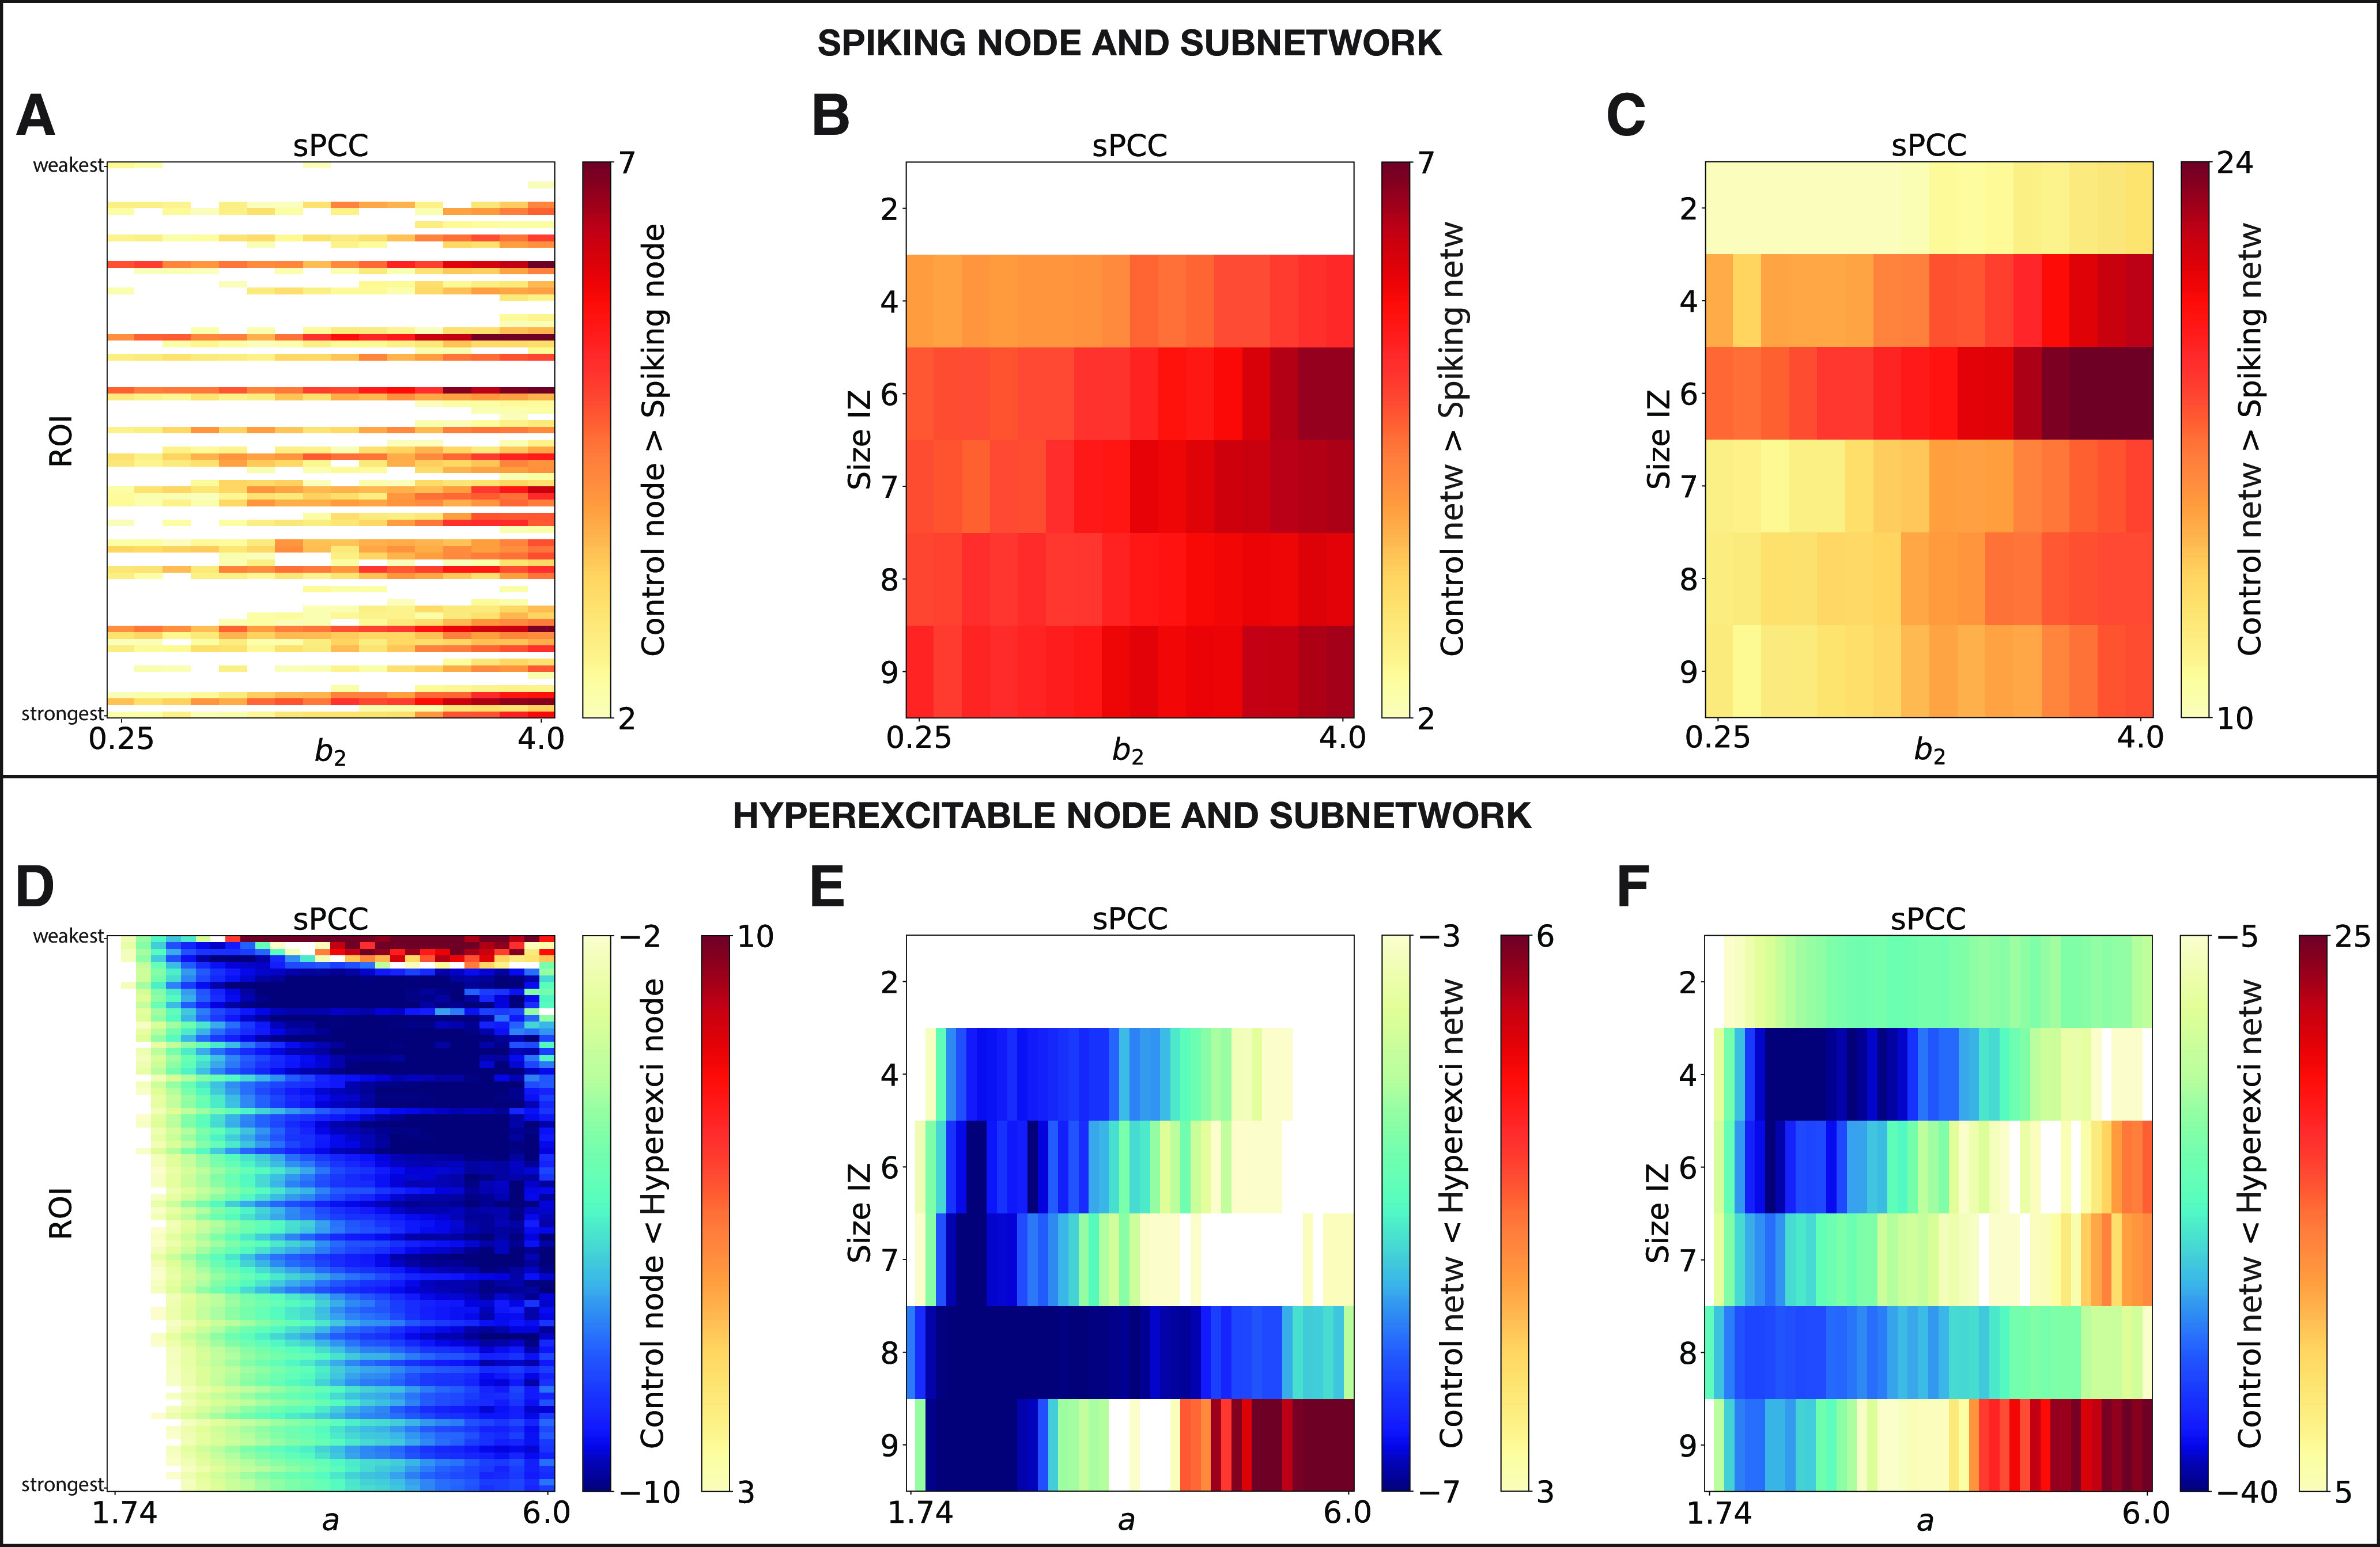
Figure 7.

Statistical comparison of the sPCC matrices between the spiking or hyperexcitable case to the control scenario. The z-score values are color coded as a function of spike frequency b2 (top row) or bifurcation parameter a (x-axis; bottom row), and spiking or hyperexcitable region ROI sorted by structural node strength (left column) or the size of the patient-specific IZ (y-axis; middle and right columns). A–F, Comparisons are for spiking or hyperexcitable region with the rest of the brain (A–D), within IZ (B–E), and IZ with the rest of the brain (C–F).
