Figure 1.
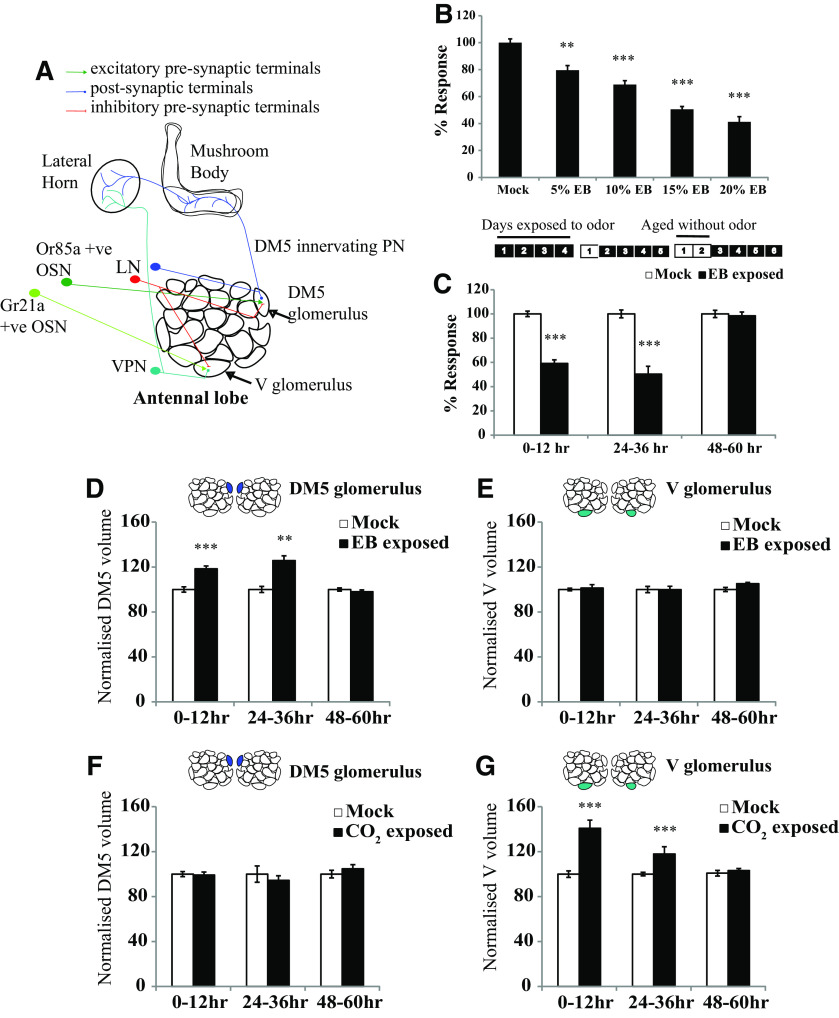
Critical period for LTH in Drosophila is closed at 2 d. A, Schematic of the antennal lobe showing OSNs, PNs, and LNs innervating the DM5 and V glomeruli. B, Early optimization of EB exposure conditions to induce long-term habituation. The histogram shows the normalized response of CS flies exposed to EB at the indicated concentrations for 4 d, with odor exposure starting 0–12 h after eclosion. C, Schematics show the odor exposure protocol. The numbers indicate the number of days after eclosion. Shaded boxes indicate that flies were exposed to odor, and unshaded boxes indicate that flies were aged without odor exposure. Normalized response index for LTH behavior of wild-type CS flies that were exposed to EB at different time periods after eclosion such as 0–12, 24–36, and 48–60 h after eclosion. N is 8–11 sets for each bar. Refer to Table 2 for actual response index (RI) values, p values, and n values. D–G, Histogram shows the quantification of glomerular volume in mock and odor-exposed flies. The shaded glomeruli in the antennal lobe schematic indicate the glomerulus analyzed after odor exposure. Normalized volume for the EB-sensitive DM5 glomerulus and CO2-sensitive V glomerulus measured after 4 d of EB (D, E) and CO2 (F, G) exposure. Refer to Table 3 for normalized volume values, p values, and n values. ***p ≤ 0.001, **p ≤ 0.01, and *p ≤ 0.05 determined by Student's t test. Error bars indicate the mean ± SEM. N is 7–27 glomeruli for each bar.

