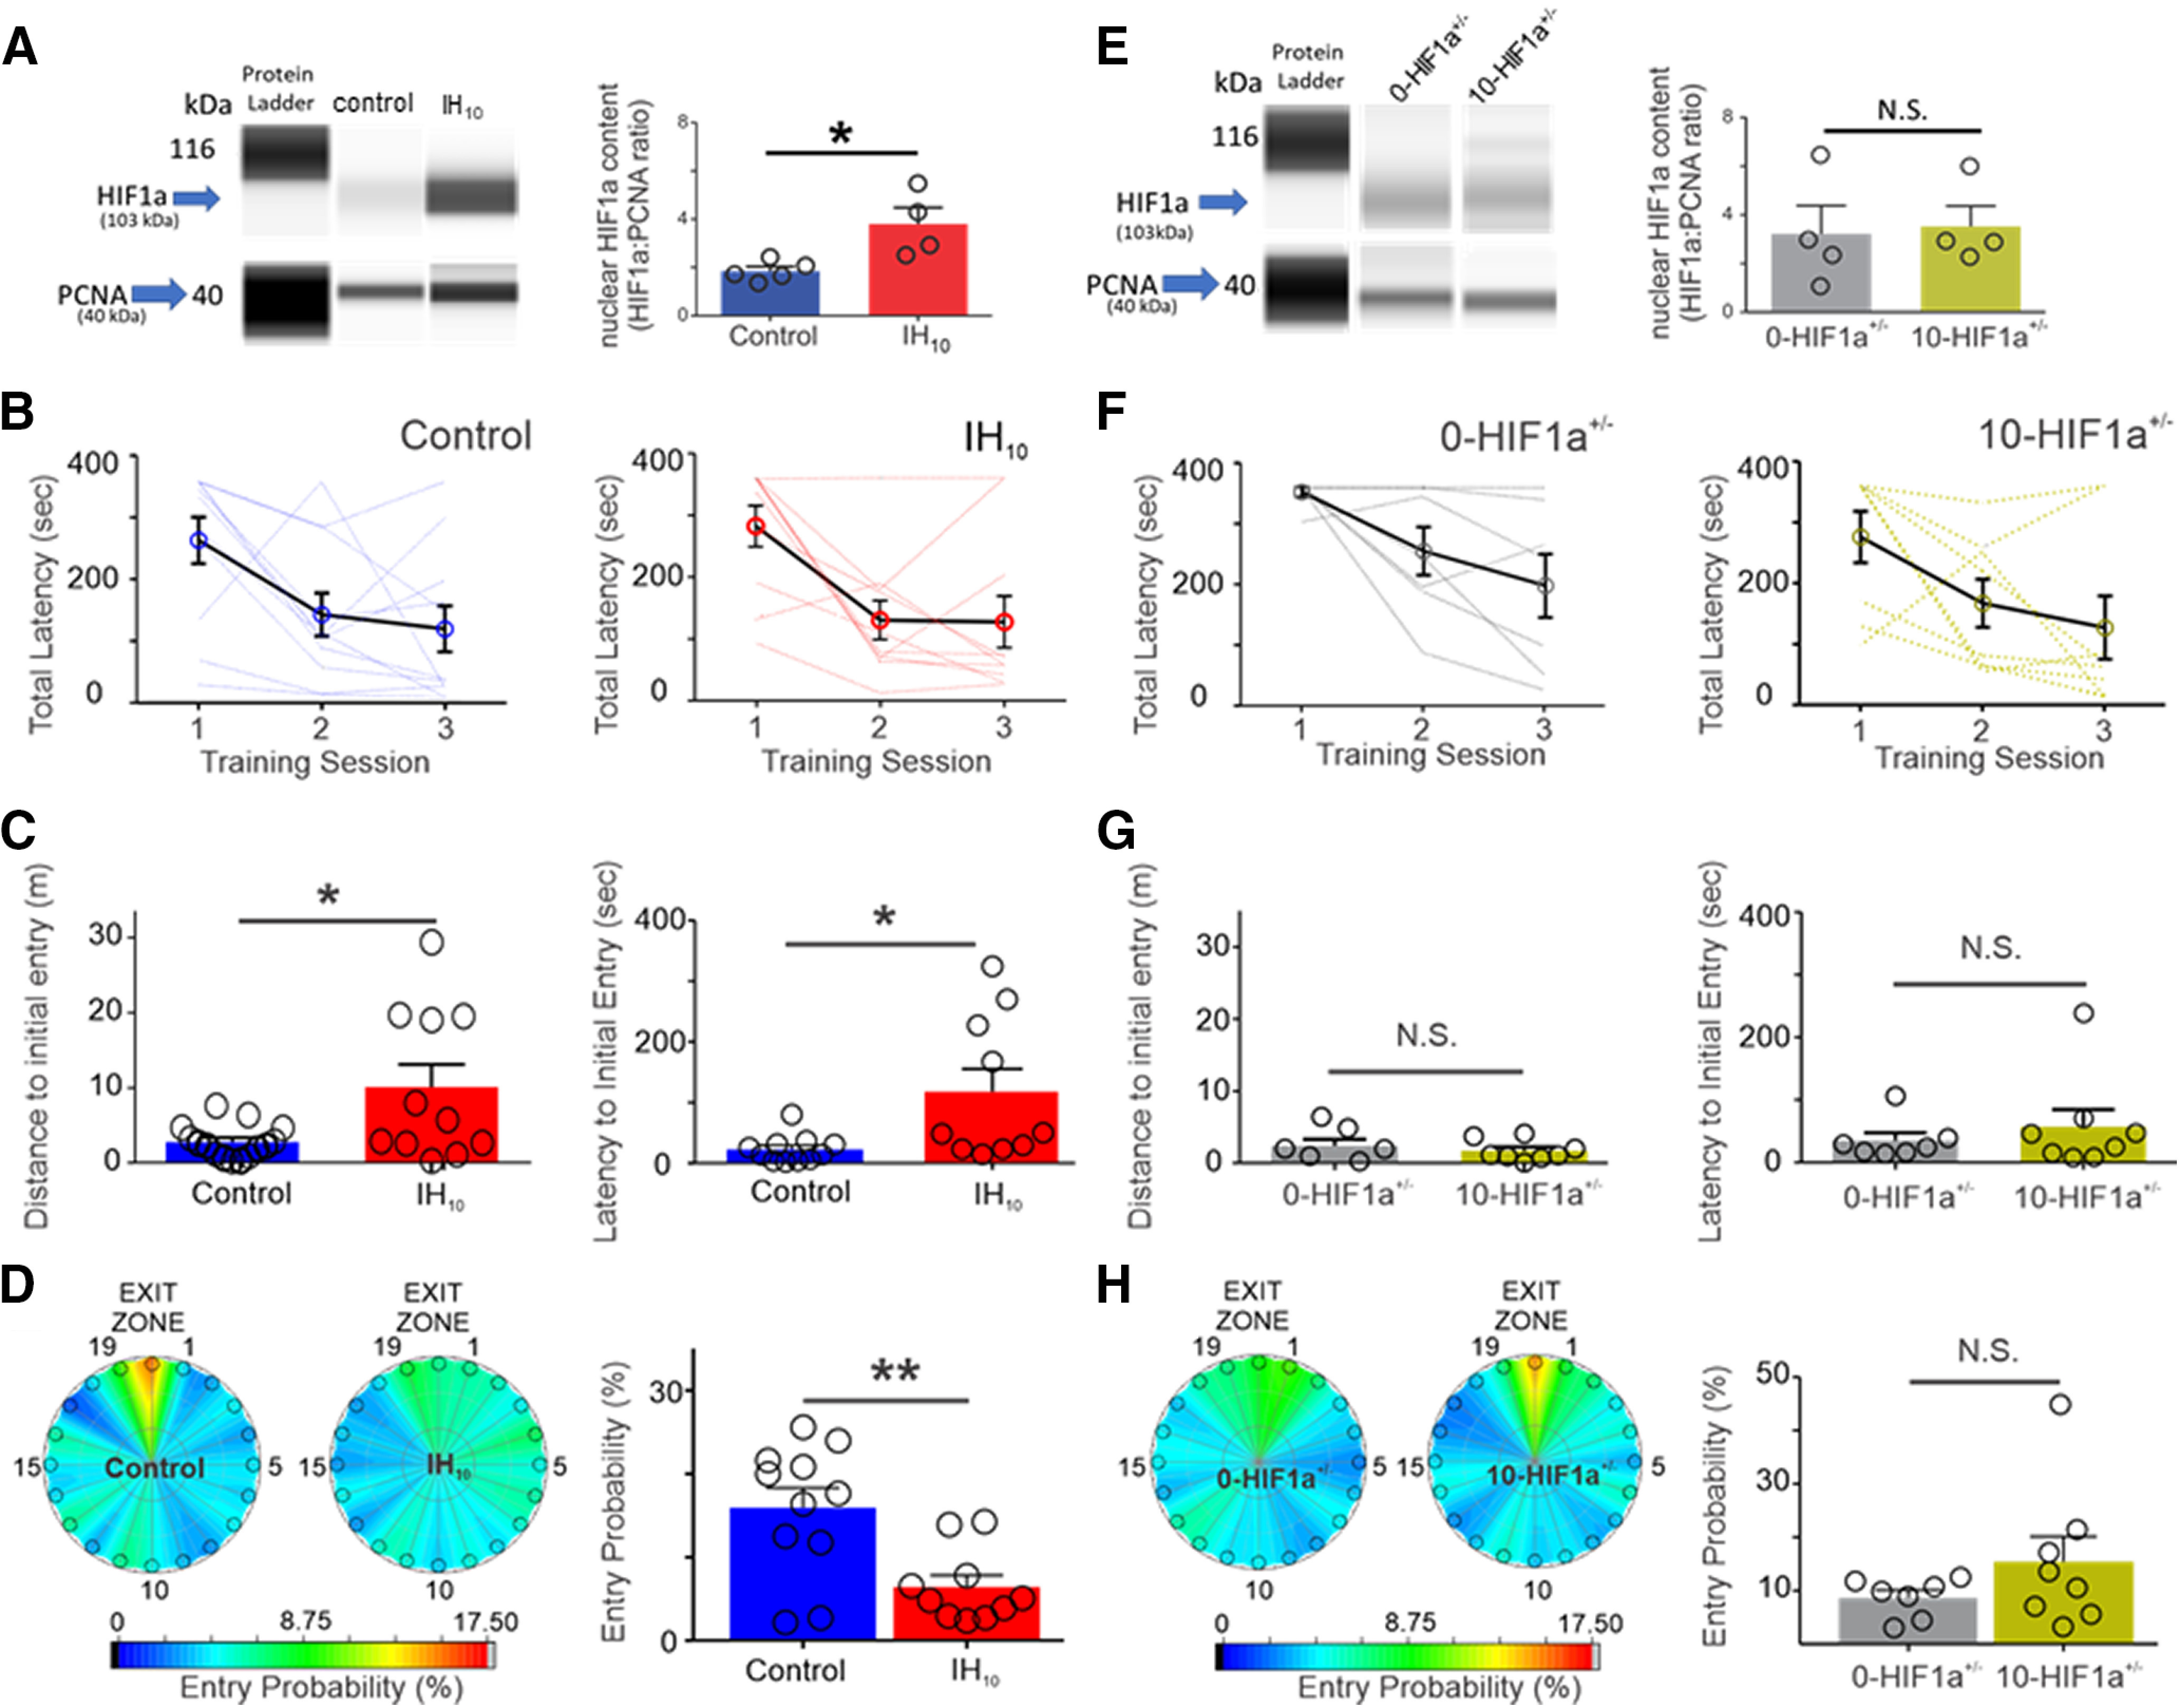
Figure 1.

Ten days of IH increases hippocampal HIF1a and disrupts Barnes maze performance in wild-type mice but not in HIF1a+/−. A, left, Representative digitized Western blotting images for HIF1a (103 kDa) and PCNA (40 kDa) in hippocampal nuclear protein fractions from control (n = 4) and IH10 (n = 4). Right, Quantification of HIF1a protein normalized to PCNA revealed that nuclear HIF1a was increased in IH10 when compared with control (p = 0.019). B, Total latency to exit the Barnes maze during three training sessions in control (n = 10) and in IH10 (n = 11). Each blue (control) and red (IH10) line represents an individual performance during training. Training to the exit was conducted over three sessions. Each session was separated by 24 hours. C, Left, During the probe trial, the distance traveled to initially enter the exit zone was shorter in control when compared with IH10 (p = 0.048). Right, Latency to initial entry was smaller in control as well (p = 0.034). D, Heat maps of the mean entry probability across all false exits (1–19) and the exit zone during probe trial for the control and IH10. Comparison of entry probability into the exit zone during the probe trial reveals that control has a greater probability for entering the exit zone when compared with IH10 (p = 0.004). E, Left, Representative digitized Western blotting images HIF1a and PCNA in hippocampal nuclear protein fractions from 0-HIF1a+/− (n = 4) and 10-HIF1a+/− (n = 4). Right, Quantification of HIF1a protein normalized to PCNA revealed that nuclear HIF1a is similar between 0-HIF1a+/− and 10-HIF1a+/− (p = 0.84). F, Total latency to exit the Barnes maze during three training sessions in 0-HIF1a+/− (n = 7) and in 10-HIF1a+/− (n = 8). Each gray (0-HIF1a+/−) and yellow (10-HIF1a+/−) line represents an individual performance during training. All experimental groups exhibit decreased total latency over the course of training. G, Left, In HIF1a+/−, the distance initial to initial entry into the exit zone was similar between 0-HIF1a+/− and 10-HIF1a+/− (p = 0.55). Right, Latency to initial entry into the exit zone during the probe trial were similar between 0-HIF1a+/− and 10-HIF1a+/− (p = 0.39). H, Heat maps of the mean entry probability into all zones during the probe trial for 0-HIF1a+/− and 10-HIF1a+/−. Entry probability was similar between 0-HIF1a+/− and 10-HIF1a+/− (p = 0.21); *p < 0.05; **p < 0.01; N.S., p > 0.05.
